Customizable Time Zones new Tutorial
You can now set ActTrader to a time zone of your choosing. Localize your application, or align it with the time zone of different world markets. Includes automatic daylight saving time changes.
Charting Package
This release includes many chart enhancements, including new measure tools, performance improvements, and new technical indicators.
Load Additional Chart History new
Configure how many candles are pre-loaded when a chart is opened.
Alerts on Penetration of a Trendline new Tutorial
Create custom alerts when the rate crosses one of your trendlines.
Measure Tool new
Quickly determine the distance between any two points on a chart with the new measure tool
Advanced Fibonacci Settings new
You can now set the properties of every line in the Fibonacci Retracement tool.
Text Labels new
Add custom text labels anywhere in the chart.
Trend line Properties new
Change the name, color, style, and other properties of manually plotted lines on the chart.
Save Charts and Chart Templates new Tutorial
Save customized charts and chart templates to be used in future sessions and even on a different computer.
Copy and Link Objects new Tutorial
Copy, paste, and link various objects across multiple charts.
Candle Formations new
Use the three new candle formation indicators (Morning/Evening Star, Tweezer, Engulfing) to analyze candle patterns for trading signals.
New Technical Indicators new
Ten new popular indicators are available in the charts.
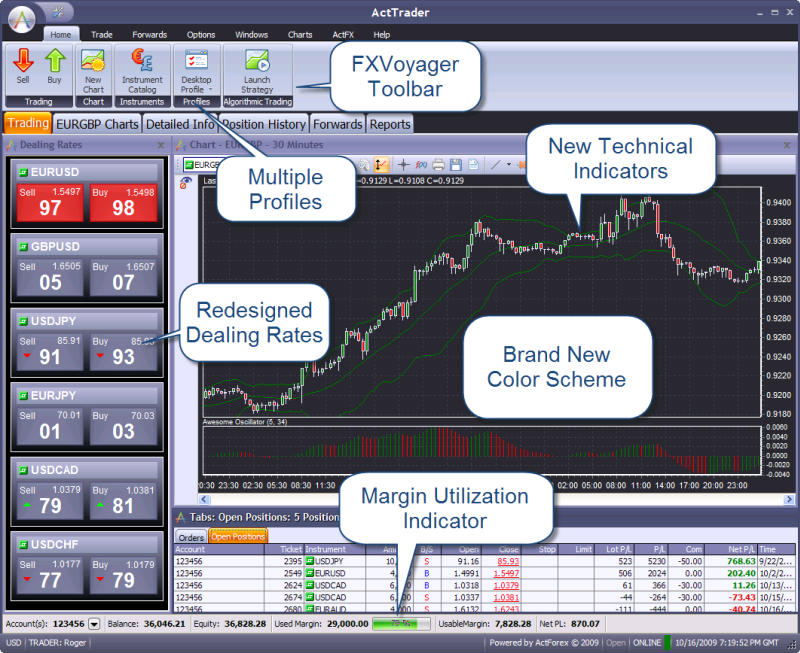
ActTrader has a brand new look and a great new interface. To find about the great new features, click on the balloons in the picture below or scroll down for more information.
It was previously possible to sort data in ActTrader only by a single column at a time. Now traders can apply several levels of column sorting. Read more |
ActTrader has a brand new look and feel, as well as an intuitive new interface in FXVoyager, a new navigation feature. Read more
|
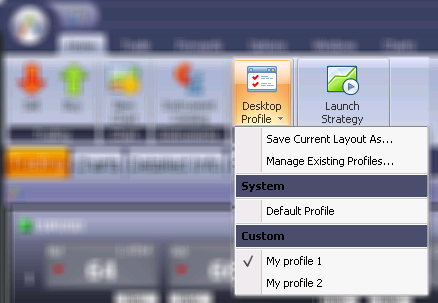
| User Profiles new |
Traders can now customize and save an unlimited number of application layouts as user profiles. Read more
|
Traders now have a quick at-a-glance view of their used margin with this handy new visual indicator. Read more
|
| Charts new |
|
new A set of new sound alerts has been added to the trading application. Read more |
This trader manual has been reorganized to be much more user-friendly. In addition to an updated Quick-Start Guide, the following new sections organize the information you need in a more intuitive way: |
This Trader’s manual now includes sections dedicated to User Indicators and Algorithmic Trading. |
We introduced a new algorithmic trading module that enables the trader to create and automatically execute trading strategies. The module has dedicated user interface with built in charts, lists of orders and open positions, strategy summary and statistics. The user can create complex strategies that involve multiple instruments and various time(candle) intervals. Furthermore, fully functional back testing allows traders to check their strategies against historic data. Documentation on algorithmic trading is in the form of a separate manual. |
It is now possible to export data from certain windows into a Microsoft Excel spreadsheet. This results in a snapshot of the window at that particular moment. Export to Excel can be done from the Orders, Open Positions, and Closed Positions windows. |
An instrument search function has been added to windows that contain lists of instruments. It has also been added to settings windows that contain instrument lists. Windows Settings of Windows |
When several Individual Dealing Rates windows or several Chart windows are opened in a row, they will now open in a cascading (overlapping) arrangement. Previously, when we opened these windows, they would all open directly on top of one another. This is more convenient, as users can now see the title bars of all the windows at once. |
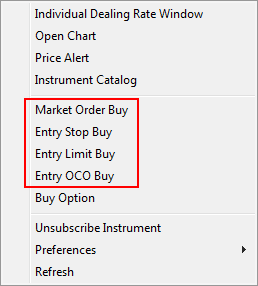
For greater clarity, the right-click menu items for creating market and entry orders have been modified to explicitly indicate the direction of the order (buy/sell).
|
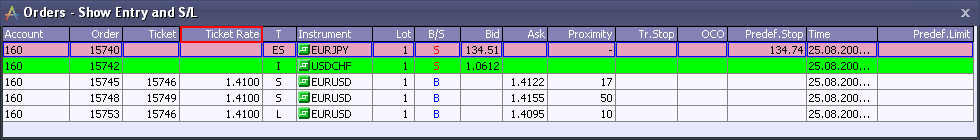
Orders aimed at closing a position previously displayed a price in both the Ask and Bid column in the Orders window (one price was the order rate, one price was the opening rate of the position). Since this can potentially lead to confusion regarding which price is the order price, the open rate of the position has been moved to a new column (‘Ticket Rate’) which is physically distanced from the Bid and Ask columns. For C, S, L,M orders (orders aimed at closing an existing position), now only one rate in either Bid or Ask column is shown and that rate is the order's rate. Previously, a parent open position rate was also shown (in blue color). This has been moved to the new column "Ticket Rate" which is situated right after the column "Ticket". Also a mouse-over hint "Open Rate of Parent Position" has been added for the new column.
|
To ensure visual clarity, the numbers in the Summary window are displayed divided with commas ('Amount K',' NH Amount K', ' NH Lot' fields). The same is done in the Instruments window ('NetChg' field), in the Open Positions, Orders and Closed Positions windows ('Amt,K' field) and in the Order Depth window. Note: This division affects both the lot and amount view and is fulfilled according to the Windows national parameter settings (comma, blank, dot, apostrophe etc.) |
They limited keyboard shortcuts introduced in the last release have been expanded with the new ability to use shortcuts to add as well as multiply order amount values. When creating a new order: New option: Pressing Ctrl-K will add 1,000 to the order amount.
(If the order amount box is blank, then pressing K or Ctrl-K will enter 1,000 into the box. Pressing K again will multiply the order amount by 1,000. Pressing Ctrl-K again will add 1,000 to the order amount.)
New option: Pressing Ctrl-M will add 1,000,000 to the order amount.
(If the order amount box is blank, then pressing M or Ctrl-M will enter 1,000 into the box. Pressing M again will multiply the order amount by 1,000. Pressing Ctrl-M again will add 1,000,000 to the order amount.) |
Trend lines and other objects available in the Drawing Tools menu in charts can now be drawn on indicators that appear below the chart.
|
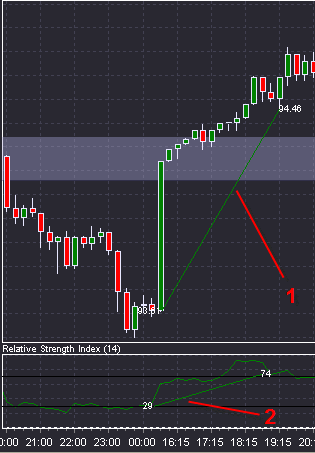
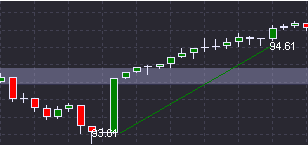
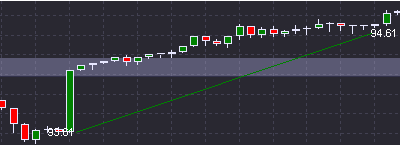
Trend lines drawn on the chart are now saved (redrawn) in the different time frame when the time interval changes in the chart.
15 minute chart
The same trend line on 1 hour chart
The same trend line after changing to 4 hours chart |
In order to improve the visual appearance of charts, indicators are now positioned in the background of the chart (underneath the candles, not over them).
|
Instrument Subscription *UPDATED*
Traders now have the option to subscribe to and unsubscribe from the instruments of their choice. One of the main immediate advantages to traders is that those trading a small number of instruments will now be able to unsubscribe from instruments they do not wish to see. This will reduce clutter on the trader interface, as well as improving performance for traders with limited internet resources.
Password Retrieval
Forgot your password? The new password retrieval feature will email it to you.
Keyboard Hotkeys (Shortcuts)
The application features hotkeys for the first time. Look for more new hotkeys in the future.
New "% Change" Column in Instruments Window
The new "% Change" column tracks the rate change for the instrument in % throughout the trading day.
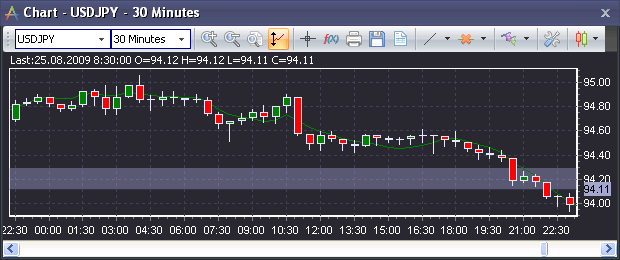
New Chart Features (Including Trading From Charts)
The charting capabilities of the application have been greatly enhanced. The biggest new improvement is the ability to make trades directly from charts. In addition, the chart toolbox has been replaced by a more functional and ergonomic toolbar, and it is now much easier to modify the chart display.
Tabbed Windows
It is now possible to group multiple windows into a single, tabbed window. This can save a lot of screen space, giving you great freedom in setting up your workspaces.
Account Information Bar
A new Account Information bar allows traders to view their account information and select the active account, no matter which workspace is currently active.
Reports Window
The new Reports window allows you to run the Trading Statistics and Account Statement reports inside the trading application, without opening a web browser.
Trading Statistics Report
This new report shows a set of statistics for all trades completed during the report period on an account or a set of accounts.
Dealing Rates Windows: New Style
The Dealing Rates and Individual Rates windows have a new style and new functionality. All dealing rates now include a miniature tick chart, giving you an at-a-glance look at the instrument's recent performance/volatility.
New Options When Creating Conditional Orders
When creating conditional orders, you can now define your order in terms of distance from the market price, as well as projected profit/loss. This is very convenient when setting up stop/limit orders, for example, as you can now configure the order based on the projected profit of the position.
Organize Managed Accounts Window
Traders who have more than one account can now administrate their own managed accounts from this new window.
Lock All Accounts
Available to traders who have more than one account, this feature allows them to keep all their accounts selected in the Account Information window indefinitely.