Saving the chart means that all the graphical objects, chart settings (common and color), indicators, instrument and interval are saved under a specified name, and may later be accessed and used.
Saving the chart template means saving the chart settings (common and color) and indicators, so that these parameters may be quickly applied to another chart, without having to set them manually.
The saved charts and templates are not a part of the user profiles; they are accessible only to the user who created them, even if he logs into the application from another computer.
Saving a chart
There are two ways to save a chart:
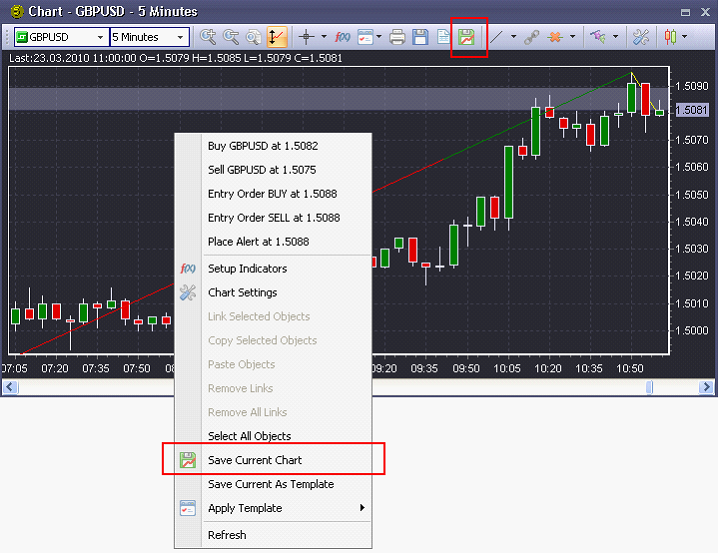
| • | Clicking the Save Current Chart button on the chart toolbar |
| • | Selecting the Save Current Chart option from the right-click menu of the chart |
After you select this option, the Save Chart As dialog box, where you can enter a new name of the chart or choose one of the existing names (names of the previously saved charts) from the drop-down box will appear:
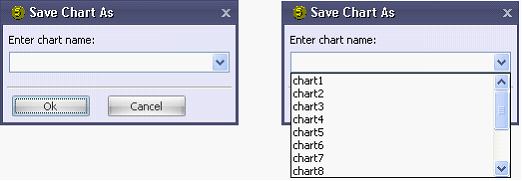
| • | If you try to save a chart that has not been saved before, the dialog box will open with an empty name field. |
| • | If the chart has been saved before, the value in the name field will be preselected. |
| • | If you select the name of the previously saved chart, the saved chart will be replaced with the current one. |
Click OK to save the chart with all its properties, indicators, and manually plotted objects.
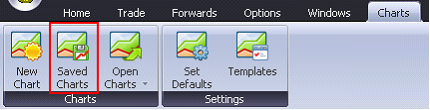
A previously saved chart may be opened by clicking the Saved Charts button in the Charts tab:
The Manage Saved Charts window with a list of all saved charts will appear:
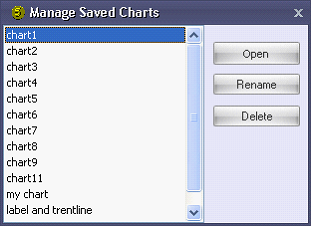
Select a chart and click Open to open the window of the selected chart. Click Rename to open a dialog box where you can change the name of the selected chart. Click Delete button to delete the chart. The following message will be displayed:
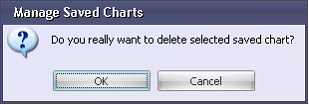
Click OK to confirm or Cancel to discard the deletion of the saved chart.
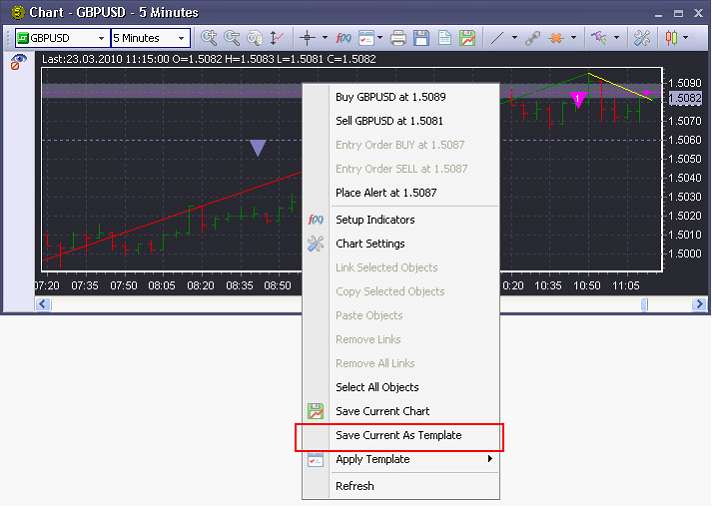
Creating the Chart Template
When you select Save Current As Template option, all the settings of the current chart will be saved (with the indicators applied).
Note: If you try to save a template without any indicators applied to the chart, the warning message will be displayed:
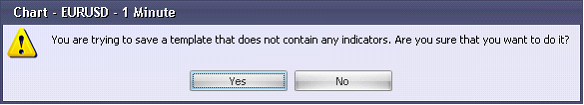
Click Yes to save the template without indicators. The Save Template As dialog box will appear:
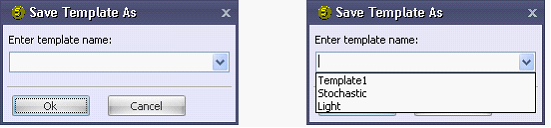
You can enter a new name or select the name of a previously created template from the drop-down box. After clicking OK a new template will be created (or the existing one will be modified).
If you try to save an existing template, the Save Template As dialog box will appear with this template name preselected.
Note: When saving a template, the only chart settings that are saved are those which differ from the default chart settings (the settings adjusted in the Set Defaults window that are applied to all new charts). If a common or color setting value in the template coincides with a common or color setting value in the ‘Set Defaults’ window, and then this value is changed in the ‘Set Defaults’ window, the value in the template will be changed correspondingly.
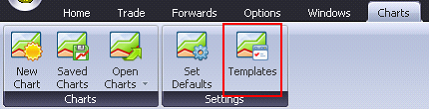
To view the previously saved template click the Templates button in the Charts tab:
The Manage Templates window will appear with the list of all the previously created templates:
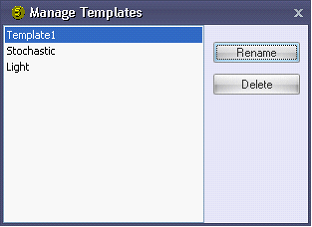
In this window you can change the name of the selected template (by clicking the Rename button) or delete the created template (by clicking the Delete button). When you try to delete a template, the following message will be displayed:
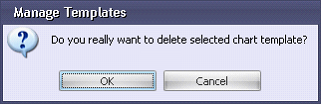
Click OK to confirm or Cancel to discard the deletion of the template.
Applying a Template
There are three ways to apply a template to the chart:
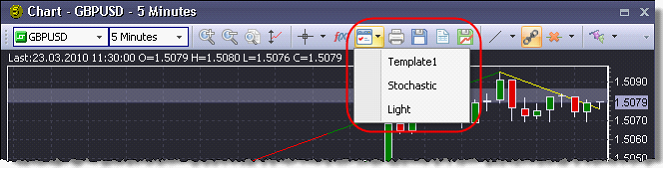
| • | Clicking the Apply Template button on the chart toolbar and selecting one of the available templates: |
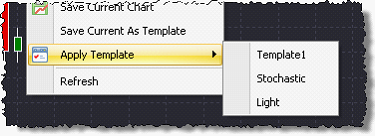
| • | Selecting Apply Template in the context menu on the chart and choosing one of the available templates: |
| • | Choosing a template in the Apply Template column in the New Chart dialog box: |
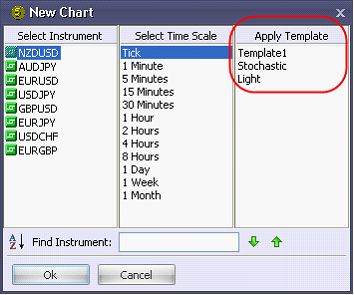
None of the templates created by you is selected by default. If you do not select any template, the new chart will have the default settings. Click on a template once to select it; click on it again to deselect it.
When a template is applied to a chart, this chart will immediately change (or be opened) according to the settings of the selected template.