Click here to view video tutorials on trading from charts.
You can place, modify, and remove market orders, conditional orders, and price alerts directly from a chart window.
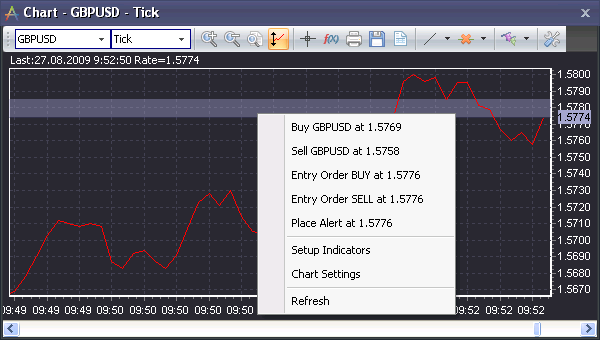
Trading from the right-click menu:
Placing a Market Order at the current rate
From the chart toolbar:
To buy or sell the instrument at the current price, click the buy or sell button in the chart toolbar. This will open the New Position dialog.
From the chart right-click menu:
Right-click somewhere on the body of the chart, and then select one of the following options:
Buy [GPBUSD] at 1.3473
This option is to buy the current instrument at the current market rate (regardless of the rate near which the mouse was clicked). It will open the New Position dialog.
Sell [GPBUSD] at 1.3469
This option is to sell the current instrument at the current market rate (regardless of the rate near which the mouse was clicked). It will open the New Position dialog.
Placing an Entry Order
To place an entry order, right-click on the body of the chart at the desired rate for the order, and then select one of the following options:
Entry Order BUY at 1.9923
This option is to place a BUY entry order at the rate where the mouse was clicked. It will open the Entry Order dialog, where you can fine-tune the order parameters, if necessary.
Entry Order SELL at 1.9923
This option is to place a SELL entry order at the rate where the mouse was clicked. It will open the Entry Order dialog where you can fine-tune the order parameters, if necessary.
Creating a Price Alert
To place a price alert, right-click on the body of the chart at the desired rate for the price alert, and then select the following option:
Place Alert at 1.9923
This option is to place a price alert at the rate where the mouse was clicked. It will open the Set Price Alert dialog where you can fine-tune the price alert parameters, if necessary.
Displaying and modifying orders, positions, and price alerts
The display of orders, positions, and price alerts is optional. There are 2 ways to activate/deactivate this feature:
In chart settings
| 1. | Right-click on the chart and select Chart Settings, or just click the chart settings icon on the toolbar ( |
| 2. | In the Common settings, check the relevant boxes for the items (orders, positions, price alerts) you wish to display. |
From the chart toolbar
| 1. | Click on the |
| 2. | Click on the arrow next to the icon to show/hide the different items separately. |
General display information
Open positions, orders, and price alerts are represented as horizontal lines in the chart. Each has its own triangle marker. The triangles allow the user to review and modify positions, orders, and price alerts.
Upward triangles ![]() indicate a BUY direction for the position/order/alert. Downward triangles
indicate a BUY direction for the position/order/alert. Downward triangles ![]() indicate a SELL direction for the position/order/alert.
indicate a SELL direction for the position/order/alert.
Note: The triangle colors displayed and referred to here are system defaults. Triangle color settings can be changed in the chart menu.
Open Positions
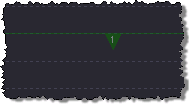
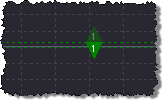
Open positions are marked by a horizontal green line with a green triangle at the rate where the position was opened. The moment the position was opened is marked by a green dot. The line to the right of the dot is solid; the line to the left of the dot is dotted. An upward triangle indicates a buy position; a downward triangle indicates a sell position. The number inside the triangle is the number of lots in the position. Triangles representing positions with a negative P/L have a red border.
View position Information: Hover the cursor over the position triangle to view information about the position, including: Ticket number, number of lots, buy/sell, open rate, open date, profit/loss, and any stop/limit orders on the position.
Quickly find position in Open Positions window: When you double-click on a position triangle, that position record will be highlighted in the Open Positions window. Also, if there is a stop and/or limit order on the position displayed on the chart, its triangle marker will flash 3 times when the position is double-clicked.
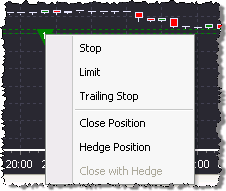
Place a Stop/Limit/Trailing Stop:
| 1) | By right-click menu: Right-click on the position triangle and then select Stop, Limit, or Trailing Stop from the menu. A dialog will appear, allowing you to set the parameters for the order. |
| 2) | By dragging: Another way to place a Stop or Limit order on the position is by dragging the position up or down to the desired order rate. To drag the triangle vertically, hold down the CTRL key and drag the position triangle up/down. You will see a faint dotted line representing a conditional order, with a translucent triangle pointing in the opposite direction from the position. Drag this line to the desired rate for the stop/limit order, and release the mouse button. A Stop/Limit order dialog will appear, allowing you to set the parameters for the order. |
Note: Whether the order will be a stop or limit depends on the rate at which the mouse button is released. For example: You have a buy position that is below the current rate. If you release the mouse button below the current rate, you will create a stop order. If you release the mouse button above the current rate, you will create a limit order.
In the event that you drag the position to create an order, and an order of that type already exist for this position, the following message will be displayed:
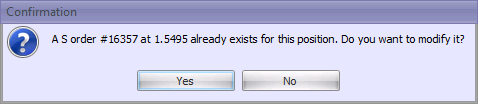
Clicking Yes will allow you to modify the order. Clicking No will cancel the operation.
Close/Hedge Position: To close or hedge the position, right-click on the position triangle, and select the appropriate command.
Dragging horizontally: You may left-click on the triangle and drag it along the position line to prevent it from obstructing your view of the chart.
Conditional Orders
Entry orders are marked with a pink line and triangle marker. Stop/limit orders are marked with an orange line and triangle marker. The point of order creation is marked with a dot. The line to the left of the dot is perforated; the line to the right of the dot is solid. An upward triangle indicates a buy order; a downward triangle indicates a sell order.
View conditional order information: Hover the cursor over the order triangle to view information about the order, including: Order number, number of lots, buy/sell, order rate, and date of order creation. The hint for S/L orders also includes the number of the parent position.
Quickly find order in Orders window: When you double click on an order triangle, that order record will be highlighted in the Orders window. In addition, double-clicking on an S/L order will make the parent position triangle flash 3 times.
Preset a Stop/Limit/Trailing Stop on an Entry order: Right-click on an entry order triangle, and then select Stop, Limit, or Trailing Stop from the menu.
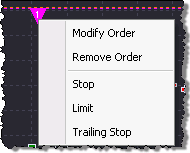
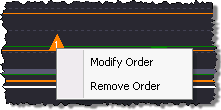
Modify a conditional order:
| 1) | By right-click: Right-click on the order triangle and select Modify Order from the menu. A dialog will appear, allowing you to set the parameters for the order. |
Entry order:
S/L order:
| 2) | By dragging: Another way to modify a conditional order is by dragging the order triangle up or down to a new rate. To drag the order triangle vertically, hold down the CTRL key and drag the triangle up/down. You will see a translucent outline of the order record, while the original order record remains in place. Drag the order to the desired rate, and release the mouse button. An order modification dialog will appear. |
Note: When dragging an existing S/L order vertically, you will not be able to drag the order to a rate that is disallowed by the current rate/condition distance setting.
Remove a conditional order: Right-click on the order triangle, and then select Remove Order from the menu.
Dragging horizontally: You may left-click on the order triangle and drag it along the order line to prevent it from obstructing your view of the chart.
Market (I and C) orders
Orders to open a position (I orders) that have not been confirmed by the dealer are marked as a translucent open position triangle.
Orders to close a position (C orders) are shown as a translucent open position triangle attached to the triangle of the position that is to be closed, and pointing in the opposite direction.
Market order information: Hover the cursor over the I or C order to view information about the order, including: Order number, number of lots, buy/sell, order rate, and the date/time of order creation.
Quickly find order in Orders window: When you double click on an I or C order triangle, that order’s record will be highlighted in the Orders window.
Remove market order: Right-click on the I or C order triangle, and then select Remove Order from the menu.
Dragging horizontally: You may left-click on the I or C order triangle and drag it along the order line to prevent it from obstructing your view of the chart. Since C order triangles are attached to the parent position triangle, dragging the C order triangle will drag the parent position triangle as well.
Dragging vertically: I and C order triangles cannot be dragged vertically.
Price Alerts
Price alerts are marked with a black dotted line and a gray triangle marker. An upward triangle indicates an alert for a sell rate; a downward triangle indicates an alert for a buy rate.
Price alert information: Hover the cursor over the price alert triangle to view information about the alert, including: Buy/Sell, rate.
Quickly find price alert in Price Alerts window: When you double click on a price alert triangle, that price alert record will be highlighted in the Price Alerts window.
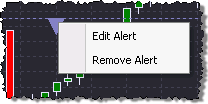
Edit price alert:
| 1) | By right-click: Right-click on the price alert triangle and then select Edit Alert from the menu. |
| 2) | By dragging: Another way to modify a price alert is by dragging the price alert triangle up or down to a new rate. To drag the alert triangle vertically, hold down the CTRL key and drag the triangle up/down. You will see a translucent outline of the alert record, while the original alert record remains in place. Drag the alert to the desired rate, and release the mouse button. A price alert modification dialog will appear. |
Dragging horizontally: You may left-click on the price alert triangle and drag it along its line in order to prevent it from obstructing your view of the chart.