Click here to view a video overview of the chart toolbar.
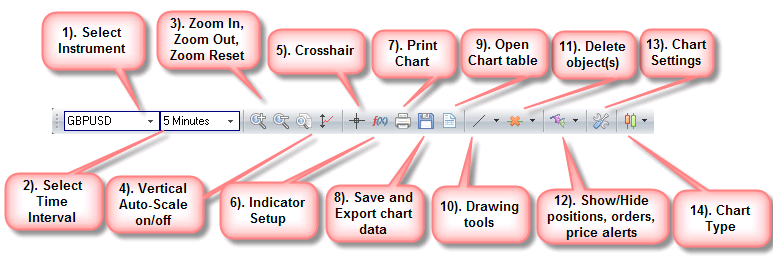
1.) Select Instrument |
Pull-down box that allows you to select the instrument in the chart. The instrument and interval settings are changed individually and independently of each other. As soon as one of these parameters is altered, the chart will refresh to reflect the change.
|
||||||||
2.) Select Time Interval |
Pull-down box that allows you to select the time interval of the chart. The instrument and interval settings are changed individually and independently of each other. As soon as one of these parameters is altered, the chart will refresh to reflect the change.
|
||||||||
3.) Zoom buttons |
These buttons allow you to zoom in, zoom out, and reset the zoom to the default chart display.
|
||||||||
4.) Vertical Auto-Scale |
The Vertical Auto-Scale button determines whether the vertical scale of the chart will automatically change in order to fit in all vertical data, whenever the chart is scrolled or zoomed.
|
||||||||
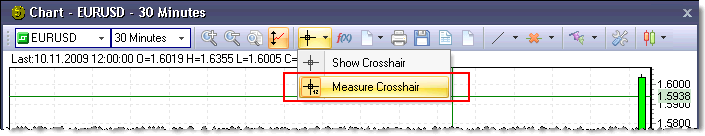
5.) Crosshair |
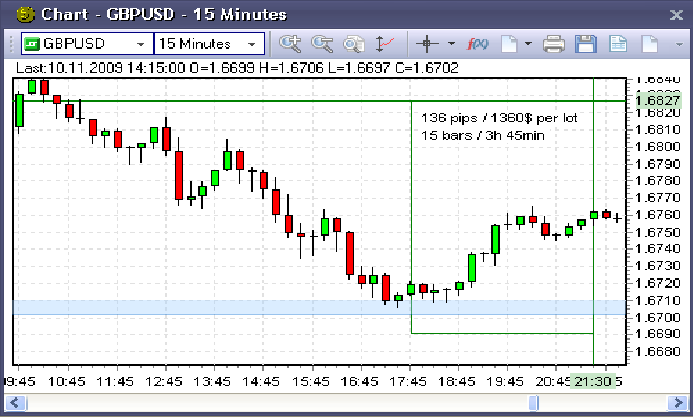
The crosshair tool turns the cursor into a crosshair, allowing you to pinpoint exact locations on the chart. The Measure tool offers a convenient way to quickly determine the distance and measurements between two points on a chart. To access this tool, click on the crosshair icon on the chart toolbar, and select Measure Crosshair from the list box:
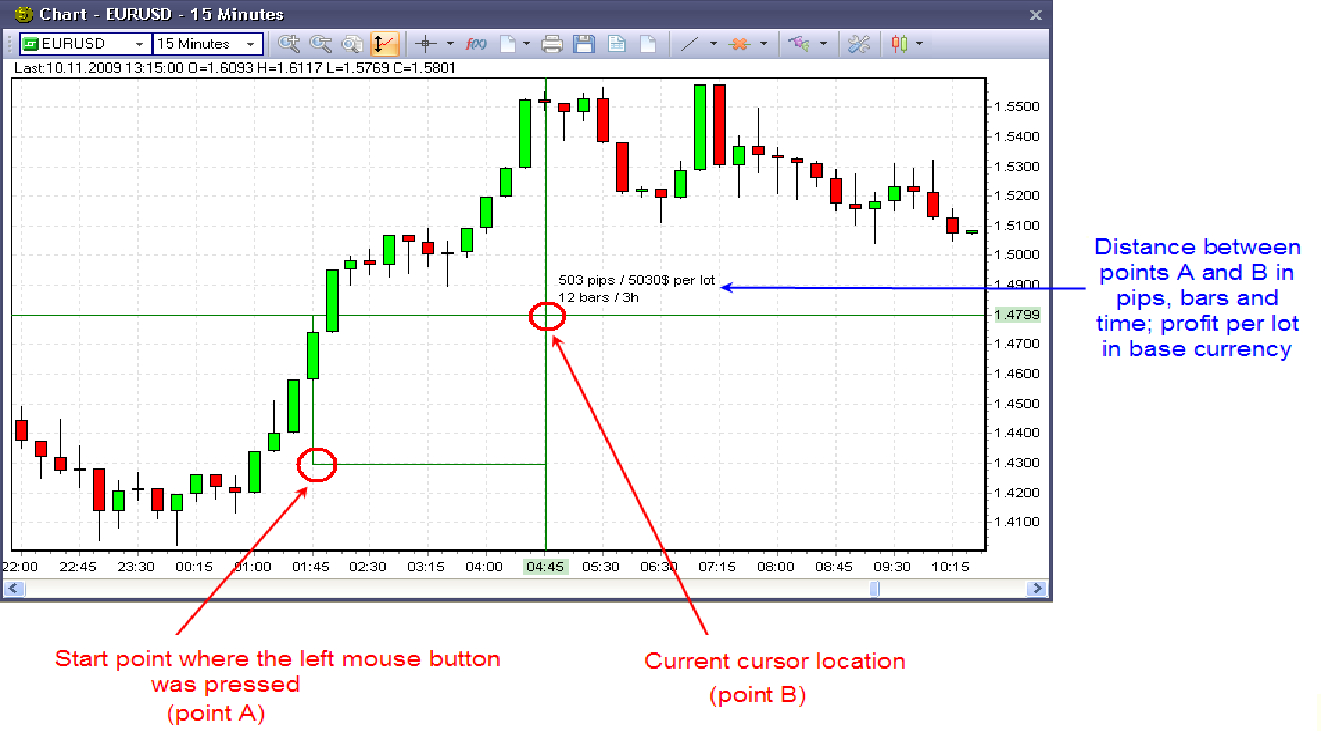
Point the center of the crosshair anywhere on the chart; press the left mouse button to set the start point of your measurement. Without letting go of the left mouse button, drag the cursor across the chart. A rectangle will be plotted from the start point to the current cursor location showing the outline of the measured chart area. At the same time you will see the following information to the right of the cursor, above the horizontal line: Distance in pips / Profit per lot /Distance in Bars /Time difference between the start point and the current cursor location. This information changes continuously as you move the cursor:
Calculation of distance between point A and point B: Distance in pips = |<Price B> – <Price A>|[in pips] Distance in bars = | <Bar number of B> – <Bar number of A>| Distance in time = | <Time of B> – <Time of A>| Profit per lot = <Distance in pips> * Pip value
The location of the text will change for a better view if the crosshair moves too close to the outside of the chart:
When you release the left mouse button, the rectangle and the text label will disappear.
|
||||||||
6.) Indicator Setup |
Opens the indicator setup menu, where you can configure the indicators appearing in the chart.
|
||||||||
7.) Print Chart |
Prints the chart
|
||||||||
8.) Save and Export chart data |
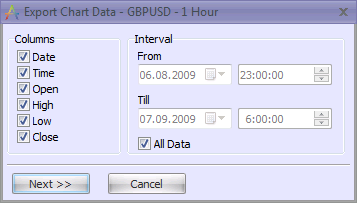
This feature lets you export data from the current chart in the form of a table. After you click the save icon, a dialog will appear, allowing you to customize the exported data:
You can select which of the 6 columns you wish to include in the table (Date, Time, Open, High, Low, Close). You can also choose to export all available time data or specify a specific time interval. When you are satisfied with the column and interval settings, click Next.
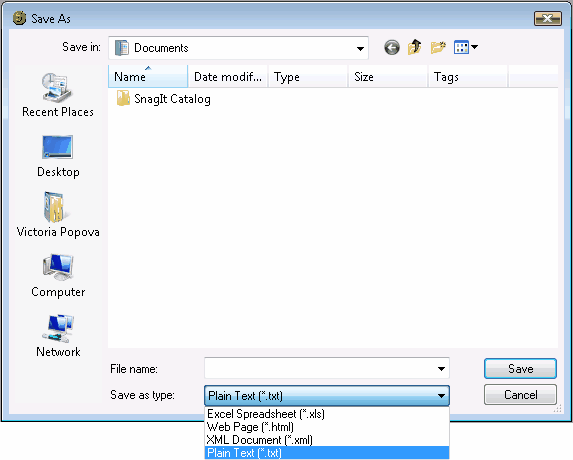
On the following screen, you can choose the file format, file name, and save location. The following export formats are available:
|
||||||||
9.) Open Chart Table |
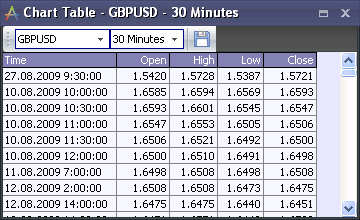
This button will open the chart in the form of a table:
The Chart Table is a tabular representation of a chart. It contains 5 columns:
Time The time of the chart update
Open Open price
High High price
Low Low price
Close Close price
Updating The Chart Table updates in real time. The frequency of updates depends on the interval setting.
Instrument and Interval Just like in a graphical chart window, the instrument and time interval may be selected from the pull-down menus at the top of the window.
|
||||||||
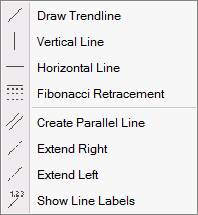
10.) Drawing Tools |
This is a pull-down menu allowing you to choose from several drawing tools:
Drawing tools can be used on the chart and on indicators appearing below the chart. |
||||||||
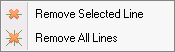
11.) Delete Object(s) |
This button allows you to remove a selected line, or all lines, from the chart.
|
||||||||
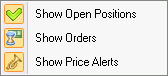
12.) Show/Hide Positions, Orders, Price Alerts |
Push this button to show/hide Positions, Orders, and Price Alerts on the chart. You can click on the arrow next to the button to hide/show these items separately.
|
||||||||
13.) Chart Settings |
Opens the chart settings menu.
|
||||||||
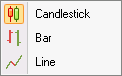
14.) Chart Type |
Allows you to select the type of the chart: candlestick, bar, or line.
|
Positioning the toolbar:
To move the toolbar, move the mouse toward the left edge of the toolbar, when the cursor turns into a crosshair, you can click and move the toolbar.