Rate of Change (ROC) displays the value of the current price relative to the price n periods ago. The ROC measures changes in prices during a certain time and displays them in the form of an oscillator showing the cyclical movements. The ROC increases along with the prices trending up, and decreases when the prices go down. High price changes result in significant ROC changes. The ROC can be expressed in either points or percentages.
Methods of use:
1. When the ROC crosses above the 0 line it is a signal to buy.
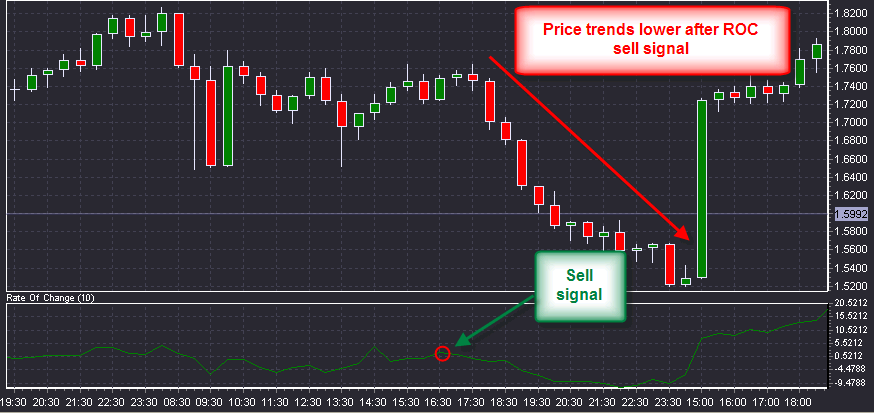
2. When the ROC crosses below the 0 line it is a signal to sell.
Note: An effective approach to using the ROC involves observing previous peaks and troughs as shown by this indicator. By comparing the current ROC value to its recent levels, a trader will know what to expect in terms of relative price movements.