Range Action Verification Index (RAVI) indicator, developed by Tushar Chande, can be used to identify whether the market is trending. It calculates the percentage difference between current prices and older prices. Current prices are represented by a Short SMA, and the longer time frame by a Long SMA. Tushar Chande recommends the following information lines for the indicator: plus-minus 0.3% or 0.1% (depending on the market).
Methods of use:
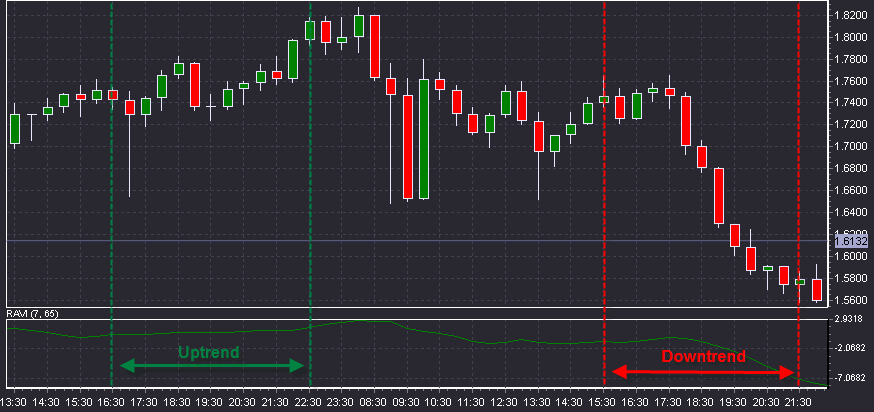
1. The uptrend began if the indicator crosses the upper information line (0.3%) from the bottom-up.
2. The downtrend began if the indicator crosses the lower information line (0.1%) from top-downward.
3. The trend is considered as continuing as long as the RAVI line grows.
4. The down trend is considered as continuing as long as the RAVI line falls.
5. If the indicator turns back to the zero line it means that the trend is over and the channel has begun.
6. If the indicator turns back again without passing between the information lines it means that the trend has resumed.