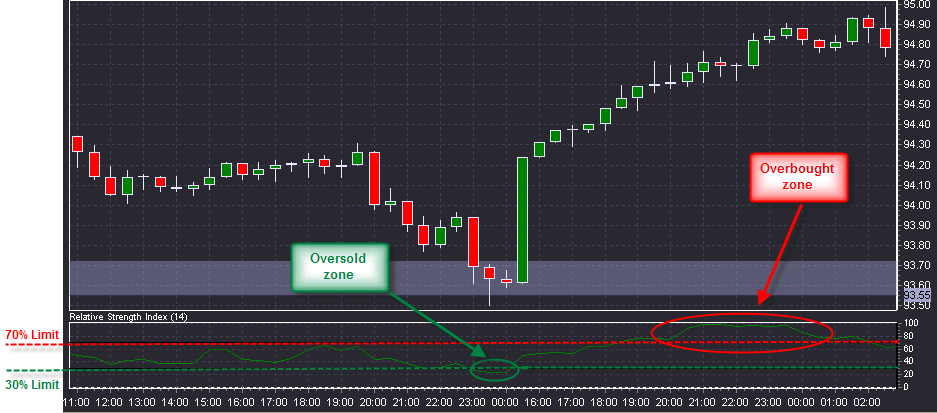
Relative Strength Index (RSI) – a price-following oscillator that ranges between 0 and 100. There are 3 distinct zones in the chart of this indicator: the upper (overbought) zone ranges from 70 to 100; the lower (oversold) zone ranges from 0 to 30; the middle zone ranges from 30 to 70.
RSI is mostly used in day trading to determine the state of the market – whether it is oversold, overbought, or stable. If the RSI tops out in the upper zone (overbought, > 70) and then returns to the middle zone, the price would move in the same direction. If the RSI bottoms out in the lower zone (oversold, < 30) and then returns to the middle zone, the price would move in the same direction.
Method of use:
overbought zone, the price is expected
| 1. | When the RSI peaks in the to follow it; this is a signal to sell. |
| 1. | When the RSI peaks in the oversold zone, the price is expected to follow it; this is a signal to buy. |
| 2. | Divergence: when the price reaches a new minimum/maximum but is not confirmed by a new minimum/maximum on the RSI chart, the price correction takes place in favor of the direction of RSI. |
Note: On the RSI chart, levels of support/resistance and reversal patterns are sometimes visible more distinctly than on the price chart.