Text labels plotting is a manual tool intended to facilitate your work with charts. This feature allows you to plot any text in the chart, move it and change its properties, and even save it for future utilization.
Plotting text objects in the chart
To access this function select the Text option in the Objects menu on the chart toolbar:
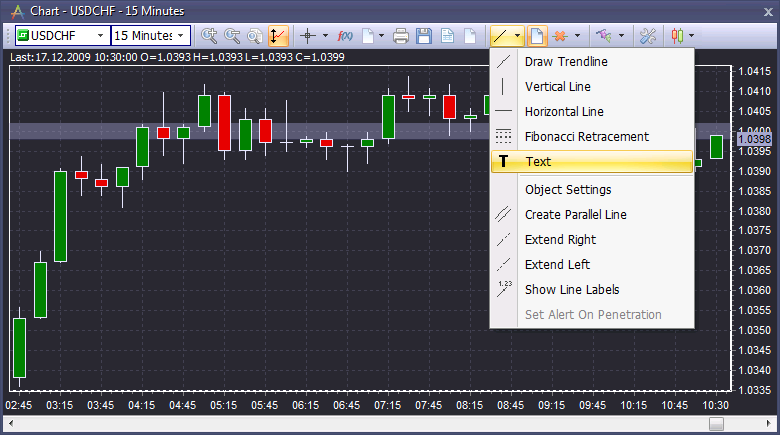
When you click on this option, the mouse pointer will turn into text-cursor: ![]() .
.
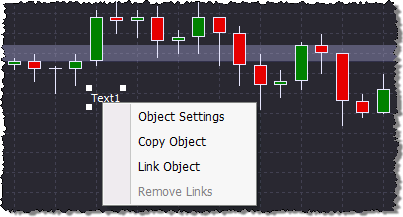
Click on the chart once, and the word ‘Text1’ will appear at that point. At the same time the Text Settings dialog box will be opened, where you can input any text, select the color, font, frame, and other parameters of the text object that will appear on the chart.
When you left-click on the text object, it becomes highlighted, and you will be able to drag it over the chart – the cursor will turn into a hand: ![]() . To paste the text label into the chart just release the mouse button. Right-clicking on the text opens the standard context menu for manually plotted objects:
. To paste the text label into the chart just release the mouse button. Right-clicking on the text opens the standard context menu for manually plotted objects:
To delete a text label left-click on it once and choose the Remove Selected Objects option on the chart toolbar.
Text Settings
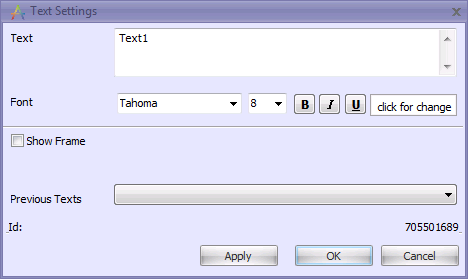
The Text Settings dialog box appears when you create the text label (as described above), and allows you to edit existing labels. There are two ways to access it:
| • | Right-click on the created text and select the Object Settings option |
| • | Double-click on the created text |
Text
The textbox allows you to input up to 200 characters that will appear on the chart. The default value for this field is ‘Text1’. When you edit the already existing label, this field will display the current text.
Font
By default the text font is Tahoma, size – 8, color – Black. Use three drop-down boxes to select any other settings for these parameters. B, I, U buttons make the text Bold/Italic/Underlined. Any changes of these parameters will not be reflected in the textbox. Click Apply to view the result in the chart without closing the dialog box.
Show Frame
By default this option is disabled. When you enable it, the window will expand to allow you to set a frame around the text and configure its properties:
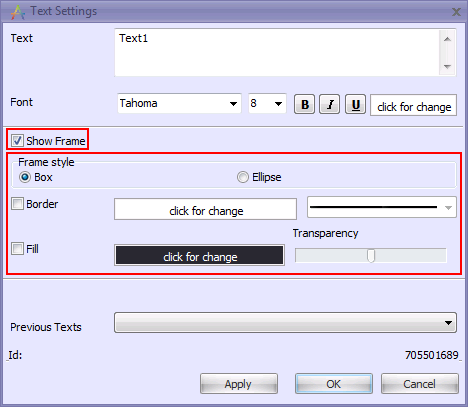
Select the Frame Style (Box or Ellipse); enable the Border checkbox to set a border for your label (if it is enabled, you can select the color and border width in the drop-down boxes); enable the Fill checkbox to set the color and transparency of the label’s background.
If you enable Show Frame without enabling Border and Fill, the label will not have any frame or background.
Previous Texts
This drop-down box lists the top 20 of the most frequently and most recently used labels. Every value you input into the ‘Text’ textbox is saved to this list (without Font and Frame settings); the list can store up to 500 values.
When the Text Settings Dialog Box is opened for the first time, the Previous Text list includes only the default text:
Buy Signal
Sell Signal
Strong Uptrend
Weak Uptrend
Strong Downtrend
Weak Downtrend
Spike!
Up Hammer
Down Hammer
Double peak
Double bottom
Head and Shoulders
When you select one of the lines in the Previous texts drop-down box, the value in the Text text box will change correspondingly.
ID
Displays the unique number of the chart object.
Click Apply to view the edited text in the chart; click OK to confirm the changes you made and close the dialog; click Cancel to discard the changes and close the dialog.