To open the chart settings menu, click on the ![]() button on the chart toolbar, or select Chart Settings from the chart right-click menu.
button on the chart toolbar, or select Chart Settings from the chart right-click menu.
Common Settings:
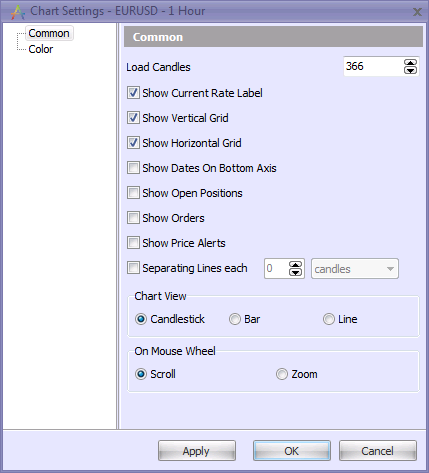
In the common settings you can select to show or hide various components of the chart.
Also you can set the number of candles (ticks) that will appear on a particular chart by means of the "Load Candles" setting. By default the application loads only 366 candles to be displayed on the chart at a time (as a new candle appears on the chart, the first one (the eldest) disappears). But you can change this value by using the up/down arrows or manually entering the values into the box. The specified number of candles will be loaded, even if you change the chart interval or select another instrument in the drop-down box of the chart window. Although this setting applies only to the current chart instance: when you open a new chart or reopen the application, the default number of candles is always loaded.
In addition, you can configure the mouse wheel to either scroll or zoom the chart.
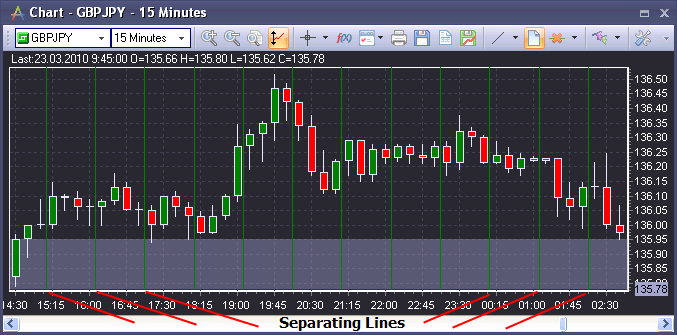
The "Separating Lines" tool allows the trader to add separating lines onto charts. This is useful for visually separating the price chart into sectors by: candles, minutes, hours, days, or months.
Color settings:
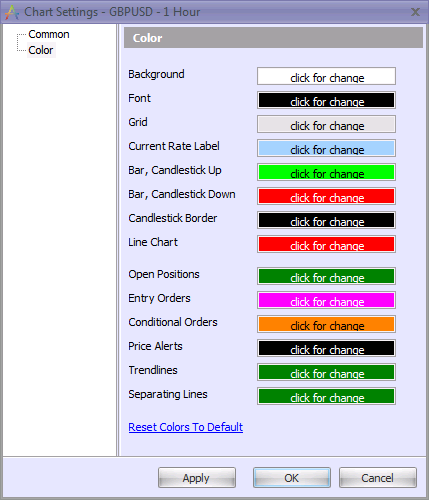
In the color settings, you can modify the colors of various aspects of the chart. In addition, you can reset the chart colors to the default setting.