Fibonacci Retracement is a chart tool used to determine the support and resistance levels on trending markets. The Fibonacci Retracement levels are created by drawing a trendline between two extreme points and then splitting the vertical distance according to the specified ratios. Fibonacci Retracement can include up to 13 lines (levels).
Plotting Fibonacci Retracement in the chart
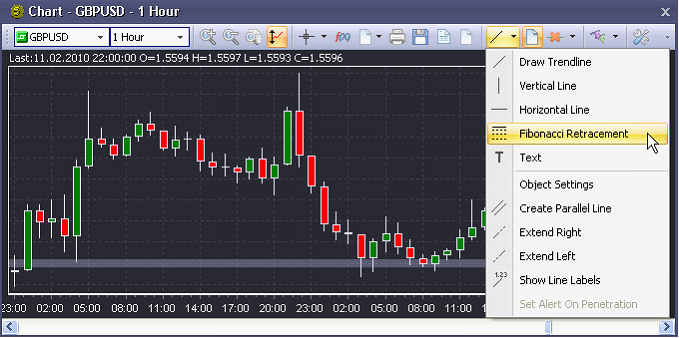
Select the Fibonacci Retracement option in the Objects menu of the chart toolbar:
When you select this option, the cursor will become finger-shaped: ![]()
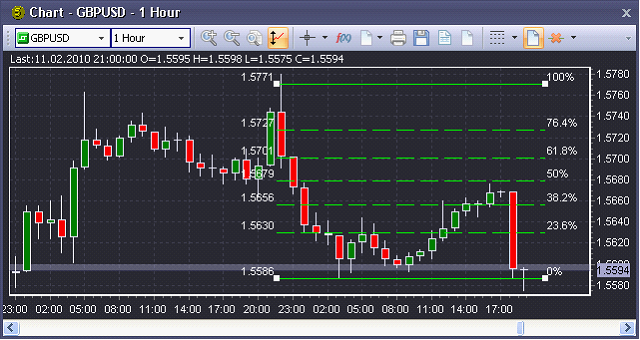
In order to plot the retracement levels, left-click on a significant High swing, and drag the cursor to the most recent Low swing (or from Low to High). The Fibonacci Retracement lines will be automatically plotted in the chart with the ratio and the corresponding price indicated by each line.
When you left click on the plotted Fibonacci Retracement object, it will become highlighted, i.e. four dots will appear at the edges of the lines. If you hover the cursor over a dot, it will turn into a crosshair allowing you to drag the dot over the chart thus resizing the Fibonacci object:
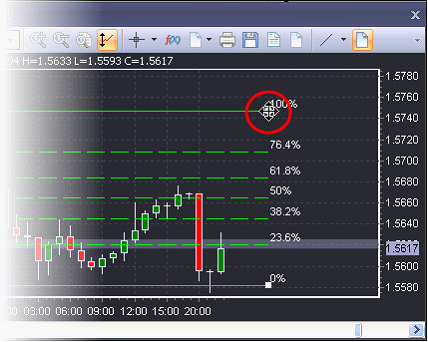
You can also drag the plotted Fibonacci Retracement object over the chart by left-clicking on its line and holding the mouse button.
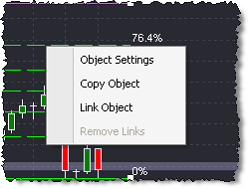
Right-clicking on the Fibonacci Retracement opens the standard context menu for manually plotted objects:
To delete the Fibonacci Retracement object left-click on it once and choose the Remove Selected Objects option on the chart toolbar.
Fibonacci Settings
You can customize the view of the Fibonacci Retracement object by using the advanced Settings dialog box, allowing to show/hide and change the view of each line.
The Fibonacci Settings dialog box appears as displayed below:
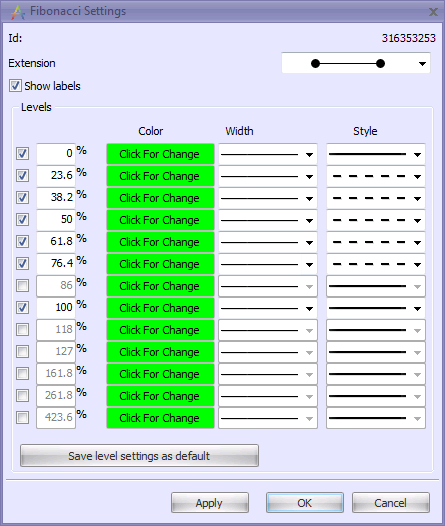
Properties description
Id
The unique number of the chart object (non-editable)
Extension
This drop-down box allows you to select the lines’ extension:
| - | limited |
| - | extended |
| - | extended right |
| - | extended left. |
This setting is applied to all the lines at the same time. By default the ‘limited’ option is selected
Show labels
When this option is enabled, labels appear at the end of each line (the rate on the left and the ratio on the right). By default it is enabled.
The Levels section contains the individual settings for each line:
| ? | The checkboxes in the very left column are used to show/hide the individual levels. When the checkbox is enabled, the corresponding line will be displayed in the chart. By default, only seven lines are enabled (as displayed above) |
| ? | The edit-boxes next to the checkboxes are used to change the percentage levels for each line. The default values of the levels are: |
| • | 0% |
| • | 23.6% |
| • | 38.2% |
| • | 50% |
| • | 61.8% |
| • | 76.4% |
| • | 86% |
| • | 100% |
| • | 118% |
| • | 127% |
| • | 161.8% |
| • | 261.8% |
| • | 423.6% |
| ? | Color - Left click on the color sample to select the line color |
| ? | Width - The width of the line. Use the drop-down box to select one of the three available options: 1 pixel, 2 pixels or 3 pixels. |
| ? | Style - The style of the line. The drop-down box includes three options: solid, dashed and dotted. Note: If the selected width is 2 pixels or 3 pixels, the Style drop-down box will be unavailable with the solid line preselected. |
Note: The Percentage edit box, Color button, Width and Style drop-down boxes are available only for enabled lines.
The ‘Save level settings as default’ button saves the settings of all the levels, so that they will be applied to all the Fibonacci Retracements created thereafter.
After you’ve made all the necessary changes to the Fibonacci object, click Apply to view the changes in the chart; click OK to confirm the changes and close the dialog; click Cancel to discard the changes and close the dialog.
The Fibonacci Settings dialog box can be accessed in three ways:
| • | Click the Object Settings button on the chart toolbar, when a Fibonacci Retracement object is selected: |
| • | Right-click on a Fibonacci object, and then click Settings. |
Double-click on the Fibonacci Retracement plotted in the chart.