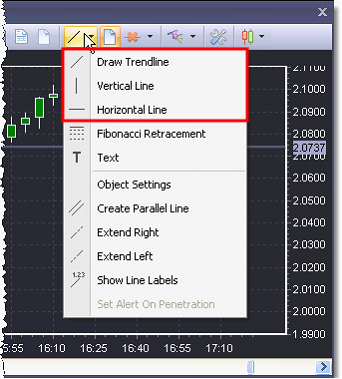
Line objects are ultimate technical analysis tools used for identifying the trends, support and resistance levels, chart patterns etc. The Objects menu offers three types of lines that you can plot in the chart:
| • | Trendline – can be drawn in any direction; it requires two points to be plotted |
| • | Vertical Line – requires only one point to be plotted in the chart |
| • | Horizontal Line – requires only one point to be plotted in the chart. |
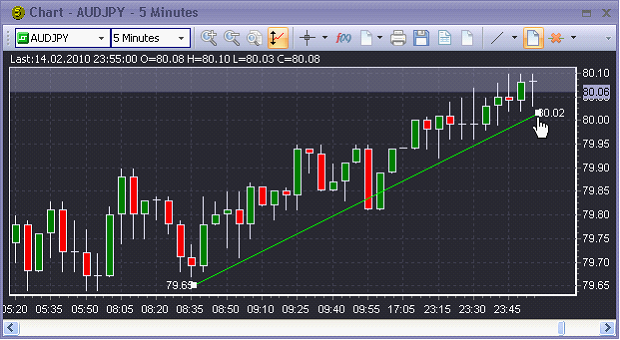
When you select any of these options, the cursor will turn into a hand: ![]() , so you can choose the start point of your line. In order to plot a trendline, drag the cursor to the end point of your line, and release it.
, so you can choose the start point of your line. In order to plot a trendline, drag the cursor to the end point of your line, and release it.
When you left-click on the line, it will become highlighted, and you will be able to drag it over the chart – the cursor will turn into a hand: ![]() .
.
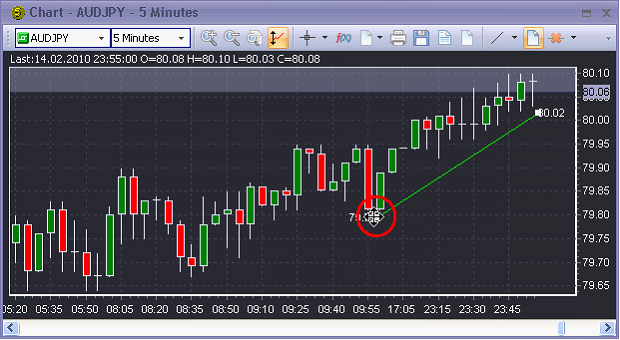
If you hover cursor over a dot on either end of the trendline, it will turn into a crosshair allowing you to drag the dot over the chart:
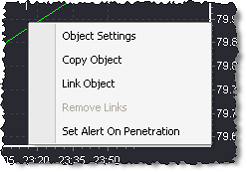
Right-clicking on the line opens the standard context menu for manually plotted objects:
To delete the line left-click on it once and choose the Remove Selected Objects option on the chart toolbar.
Lines Properties
The properties of any line manually plotted in the chart can be changed in the dialog-box, which may be accessed in three ways:
| • | Double-click on the line |
| • | Right-click on the line and select the Object Settings option from the context menu: |
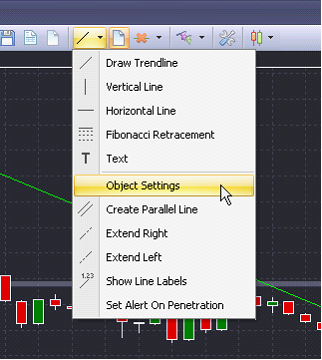
Left-click on the line to select it, and then select the Object Settings option from the Objects menu on the chart toolbar:
Trendline Settings dialog box
When the Trendline Settings dialog box opens, it displays current settings of the selected trendline:
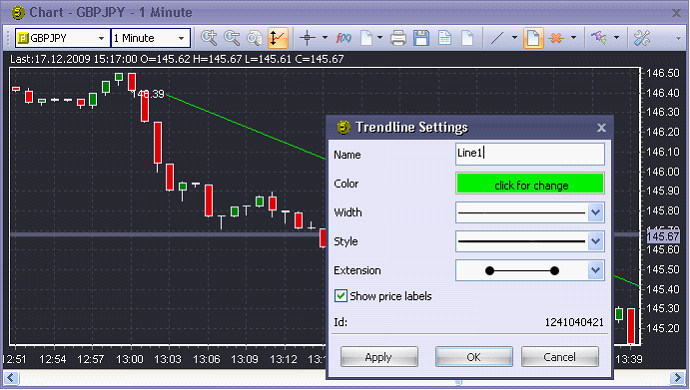
This dialog allows you to customize the following properties:
Name
The name of the trendline. (If you create an alert on penetration of the trendline, this name will be displayed in the Trendline column of the Chart Alerts table). The default name of the trendline is ‘Line’ with an order number, which is incremented by 1 for each trendline created within the individual instance of a chart. You can input up to 20 symbols into the textbox. Empty values are not allowed.
Color
The color of the trendline. Left click on the color sample will open the dialog for color selection.
Width
The width of the trendline. The drop-down box allows to select one of the three available options: 1 pixel, 2 pixels or 3 pixels.
Style
The style of the trendline. The drop-down box includes three options: solid, dashed and dotted.
Note: If the selected width is 2 pixels or 3 pixels, the Style drop-down box will be unavailable with the solid line preselected.
Extension
This drop-down box includes the options:
| - | limited |
| - | extended |
| - | extended right |
| - | extended left. |
Show price labels
When this option is enabled, the price labels will appear on the edges of the trendline.
ID
The system number of the line.
Click Apply to view the changes in the chart; click OK to confirm the changes you made and close the dialog; click Cancel to discard the changes and close the dialog.
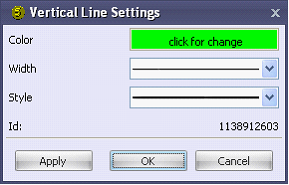
For vertical and horizontal lines the Line Settings dialog opens with the limited set of properties: