Technical Indicators

There are numerous Technical Indicators available in the charting application. In addition, you can also design your own indicators with the User Indicator Editor.


To apply an indicator, click the f(x) button on the chart toolbar, or select Setup Indicators from the chart right-click menu.


ribbon251


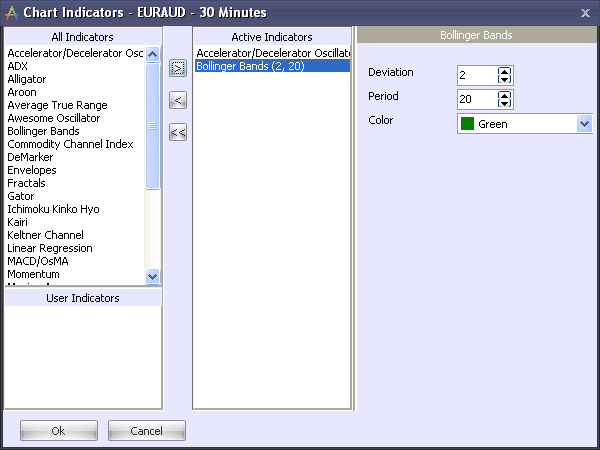
In the Chart Indicators menu, you can select indicators from the All Indicators box, and add them to the Active Indicators box using the > button. Active indicators will appear on your chart. The right section of the menu allows you to configure individual indicators.


The following indicators are available:


Accelerator/Decelerator
Average Directional Movement
Alligator
Aroon
Auto Trendlines
Average True Range
Awesome Oscillator
Bollinger Bands
Chandelier Stop
Commodity Channel Index
DeMarker
Dual Moving Averages
Engulfing
Envelopes
Flipit
Fractals
Gann Swing Chartist
Gator
Hi Lo Activator
Ichimoku Kinko Hyo
Kairi
Keltner Channel
Linear Regression
Moving Average Convergence/Divergence
Momentum
Morning and Evening Star
Moving Average
Parabolic SAR
Perry Kaufman's Adaptive MA
Pivot Points
Price Channel
Rate of Change
RAVI
Relative Strength Index
Standard Deviation
Stochastic
Stochastic RSI
T3 Tilson
TRIX
Tweezer
Weighted Close
Williams' Percent Range