Stochastic RSI represents a combination of two frequently used indicators: Stochastic and Relative Strenght Index. All in all, this is the Stochastic indicator of the RSI indicator. Stochastic RSI is similar to the regular Stochastic, but calculated based on the RSI values, instead of the price values.
Stochastic RSI concists of two lines: the main line is called %K (green), and its Moving Average is called %D (navy).
Methods of use:
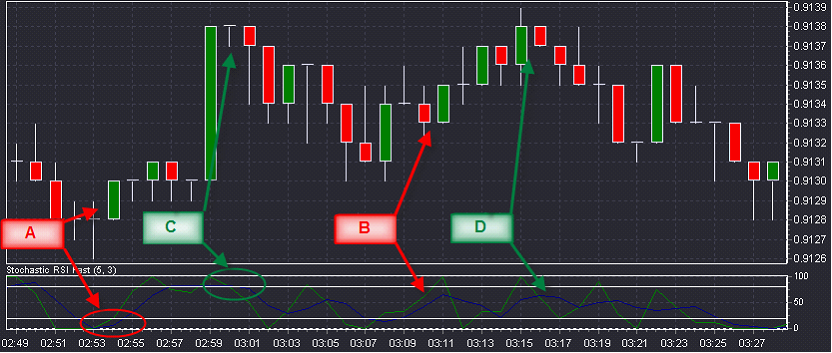
| 1. | When one of the lines of the Stochastic RSI falls below 20% and then rises above that level (A) or when the %K line rises above the %D line (B), it is a signal to buy. |
| 2. | When one of the lines of the Stochastic RSI rises above 80% and then falls below that level (C) or sell when the %K line falls below the %D line (D), it is a signal to sell. |
| 3. | Divergence: if rates produce a series of new minimum/maximum and the oscillator does not, then some rate correction is possible in the direction of the oscillator’s movement. |