Stochastic is an oscillator that compares where an asset’s price closed relative to its price range over a given period of time. It consists of two lines: the main line is called %K (green) and the secondary is called %D (navy). In the main line (%K), fluctuations are usually more distinct than in the secondary line (%D), because %D is a Moving Average of the line %K. Stochastic indicator is measured on a scale from 0% to 100%.
The Stochastic oscillator is mostly used on the trending markets. If both lines (%D and %K) top out in the upper zone (above 80% mark) and then the indicator returns to the middle zone, the rate would move in the same direction. If both lines bottom out in the lower zone (below 20% mark) and then the indicator returns to the middle zone, the rate would move in the same direction.
Method of use:
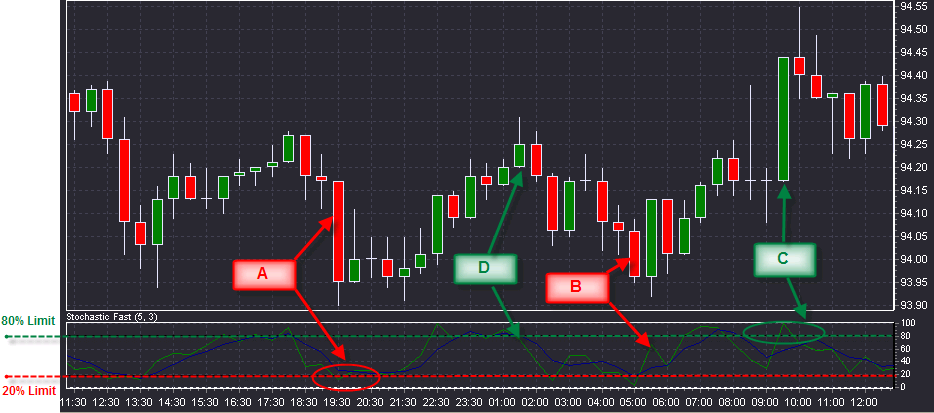
| 1. | When one of the lines of the Stochastic falls below 20% and then rises above that level (A) or when the %K line rises above the %D line (B), it is a signal to buy. |
| 2. | When one of the lines of the Stochastic rises above 80% and then falls below that level (C) or sell when the %K line falls below the %D line (D), it is a signal to sell. |
| 3. | Divergence: if rates produce a series of new minimum/maximum and the oscillator does not, then some rate correction is possible in the direction of the oscillator’s movement. |