T3 Tilson is a variation of Moving Average, developed by Tim Tilson. It is smoother and less lagging than most types of moving averages.
As a Moving Average, T3 Tilson is used to define the areas of support and resistance, to emphasize the direction of the trend, and to smooth out price and volume fluctuations. The direction of the indicator shows whether a bullish or bearish trend is present in the market at the moment. The intersection of the indicator and the price chart confirms the change of the trend.
Methods of use:
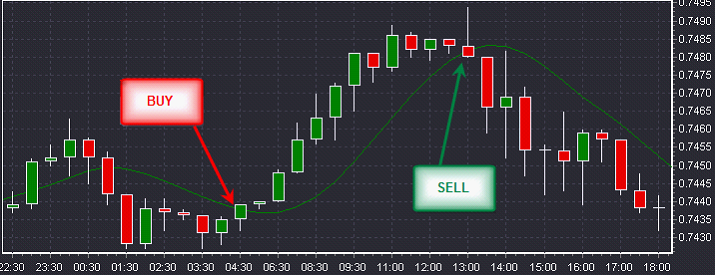
| 1. | When the instrument price rises above theT3 Tilson, it is a signal to buy. |
| 2. | When the price falls below the T3 Tilson, it is a signal to sell. |
| 3. | The direction of the T3 Tilson gives an idea of whether there is a bearish or bullish trend on the market. |