Pivot Points is the indicator that calculates the average of the highest, the lowest and the last close price of the previous time period to predict the further support and resistance levels. It is often used to forecast the range of prices variation and demonstrates the possible points of reversals in price movement.
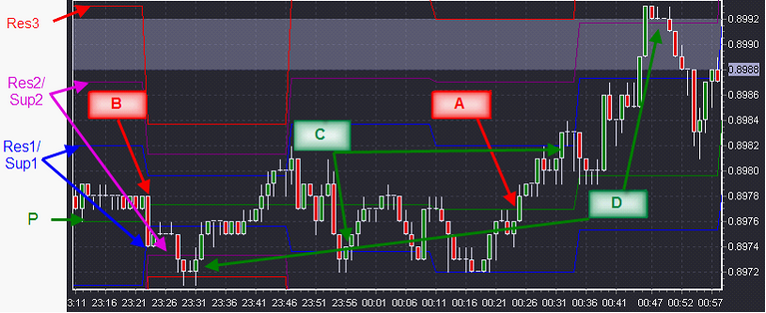
This indicator includes 7 lines: pivot (or equilibrium) point itself (P), 3 resistance levels (Res) and 3 support levels (Sup).
The largest price movements are expected to be close to the pivot point between the 1st resistance and the 1st support level. When the rate breaks out the pivot point upward or downward, it is a signal of probable uptrend or downtrend respectively. The support and resistance levels are frequently used to enter or exit the trade.
Methods of use:
| 1. | When the price crosses the pivot point upward (A), it is a signal to buy. |
| 2. | When the price crosses the pivot point downward (B), it is a signal to sell. |
| 3. | The trader may place Entry orders if the price touches the Res1 or Sup1 level (C), likely to cause a trend reversal |
| 4. | The trader may place stop/limit orders if the price reaches the Res2, Res3 or Sup2, Sup3 levels (D), as it signals that the market is overbought or oversold. |