Bollinger Bands (BB) is an indicator that compares volatility and relative price levels over a period of time. Bollinger Bands adjust to the market conditions. As soon as the market becomes more volatile, the bands widen; they contract during less volatile times.
The use of Bollinger Bands is based on the fact that prices usually remain within the limits of upper and lower borders. BB are mostly used for determining if the current value of a data field is behaving normally or breaking out in another direction. BB can also be used for identifying when trend reversals should be expected. The variable width of BB is caused by the volatility of prices.
Methods of use:
| 1. | Sharp changes in price take place after the channel narrows. |
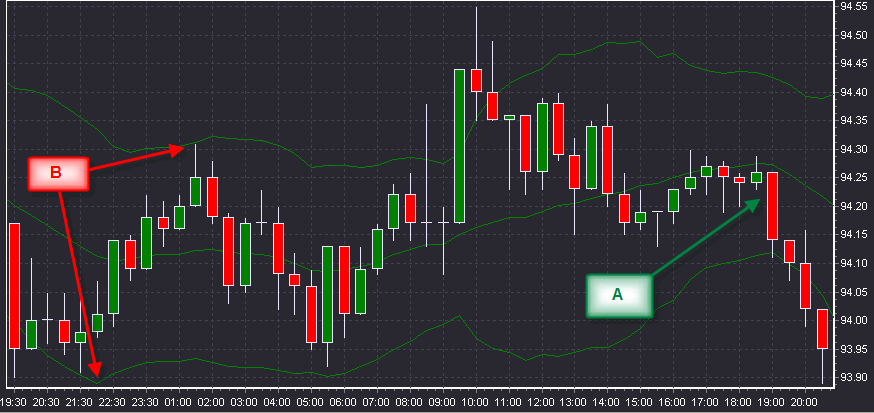
2. If prices cross the border, it is a signal that the current trend will continue(A).
3. A price move that originates at one border tends to go all the way to the other border(B).