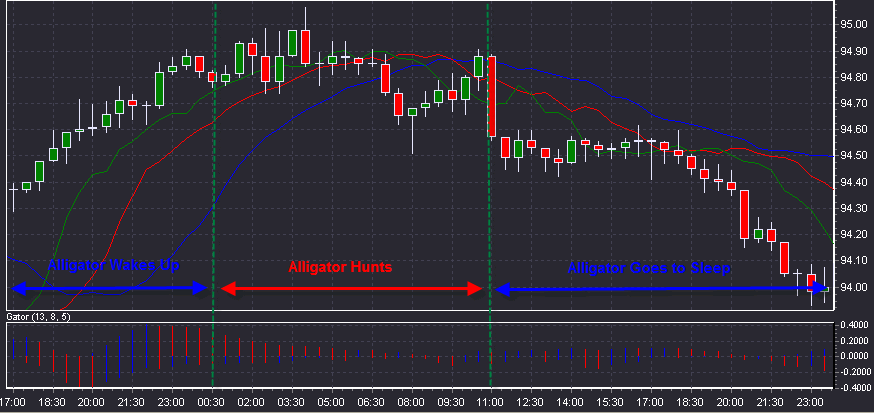
Gator, an oscillator based on the Alligator indicator, demonstrates the degree of divergence/convergence of smoothed Moving Averages.
This oscillator is indicated in the form of two bar charts, one on either side of the zero line. The top bar chart shows the distance between the red and blue lines. The bottom bar chart shows the distance between the red and green lines. The bars of the chart are red and blue: the bar becomes red when its value is lower than the previous one and green when its value is higher than the previous one.
Gator Oscillator helps to visualize and determine the presence or absence of a trend at the given period of time. It also helps to visualize periods of rapprochement and crossing of the smoothed Moving Averages (balance lines).