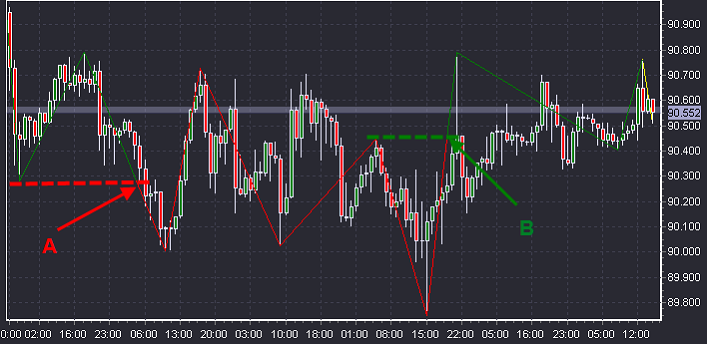
The Gann Swing Chartist indicator is an efficient tool for determining the trend direction and the support and resistance levels. It filters out a big amount of noise in the chart depicting the most important movements.
There are four basic definitions related to this indicator: UpSwing (when the indicator line is ascending), DownSwing (when the indicator line is descending), UpTrend (when there is a series of rising valleys), and DownTrend (when there is a series of diminishing peaks).
The indicator trend changes from down to up when the UpSwing passes the previous peak, from up to down - when the DownSwing passes the previous valley. When the trend is changed, the indicator line starts to be plotted in a different color.
The swing direction changes from down to up when the swing is down and there are at least N consecutive higher highs, from up to down – when the swing is up and there are at least N consecutive lower lows. (N is determined by the Bars to Swing parameter). If the FastTrack option is enabled, the swing direction will also change if the low/high of the candle is lower/higher than the previous valley/peak.
If there are not enough consecutive higher highs (lower lows) to determine the swing, the indicator color will be different from the UpTrend and DownTrend.
The swing tops indicate the resistance levels, and the swing bottoms indicate the support levels.
The Gann Swing Chartist can also be used in conjunction with the HiLo Activator and Fibonacci retracement to determine the points to enter and exit the market.
Methods of use:
| 1. | The downtrend (plotted in red) starts in the point A, where the price goes lower than the previous valley. This makes a good signal to sell. |
| 2. | The uptrend (plotted in green) starts in the point B, where the price goes higher than the previous peak. This makes a good signal to buy, |
