Tweezer belongs to a candle formations (paterns) indicator type. (Read more about candle formations here)
Bullish Tweezer and Bearish Tweezer.
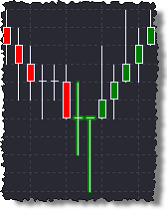
Bullish Tweezer is a reversal pattern consisting of two candles with very long lower shadows, which occurs after an extended downtrend. It gives a buy signal, and may also indicate a new support level.
Below is an example of the Bullish Tweezer pattern in a candle chart:
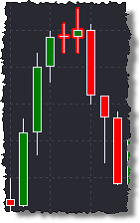
Bearish Tweezer is a reversal pattern consisting of two candles with very long upper shadows, which occurs after extended uptrend. It gives a sell signal, and may also indicate a new resistance level.
Below is an example of the Bullish Tweezer pattern in a candle chart:
Methods of use:
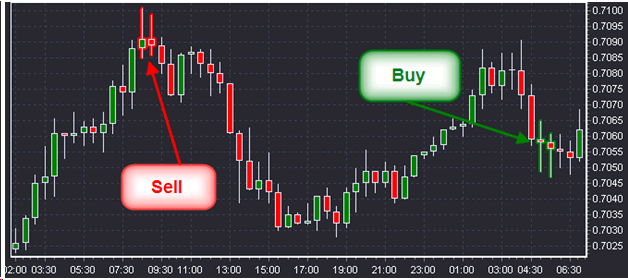
1. When the Bullish Tweezer pattern (highlighted in green) occurs, it is a signal to buy.
2. When the Bearish Tweezer pattern (highlighted in red) occurs, it is a signal to sell.