Candle formations (paterns) are a type of indicator that analyses the patterns and highlights groups of candles falling under particular rules. Candle formations give traders important signals; in particular, they indicate trend reversals. Three types of candle formations are implemented in ActTrader – Morning and Evening Star, Tweezer, and Engulfing.
Displaying candle formations in charts
Candle formations do not draw any additional lines, etc on the charts – they just highlight certain portions of the original chart graph. See the examples below:
Highlight in different kinds of charts |
||
|---|---|---|
Candle chart |
Bar chart |
Line chart |
|
|
|
In order to make the candle formations more distinguishable in the chart, each formation can have a transparent background highlight, which is activated via the ‘Background highlight’ checkbox available in the indicator settings.
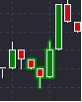
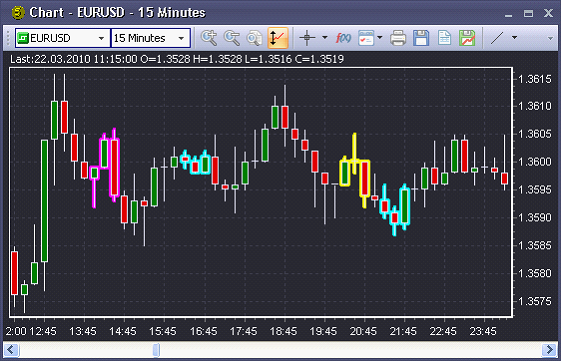
When the checkbox is disabled, only the candle highlight is used. In the example below, several candle formation indicators are applied to the chart:
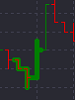
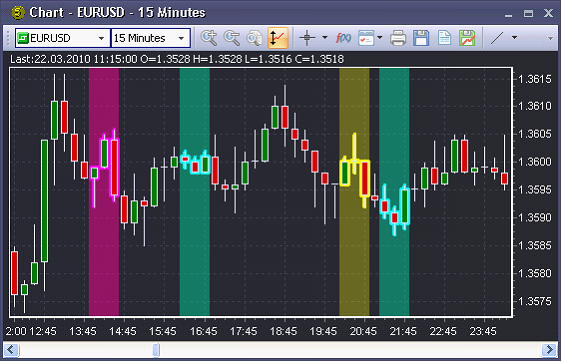
When the checkbox is enabled, both the candle highlight AND the background highlight are used. The background of corresponding formation will be highlighted in the same color as the candles:
If several indicators are displayed on the same candle, the color of the top one (most recently applied) will be used for highlighting.
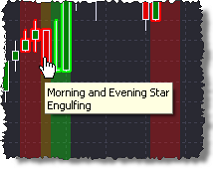
When you rollover a highlighted candle, the name of the candle formation indicator(s) will be displayed: