The Flipit indicator is a stop and reverse indicator based on the high and low price values. It is used for generating both entry and exit signals. For the uptrend, the Bottom line is plotted in the chart, for the downtrend, the Top line is plotted.
This indicator has a step-like appearance. Each indicator value is displayed in two candles at a time: in the one for which it is calculated, and in the following one.
The Bottom line lies below the candles. If the value happens to cross the candle cutting the specified number of pips from below (Number of points to switch), the current value of the Bottom Graph will be displayed in the following candle, but not after it. The Top Graph will start from the current candle.
The Top line lies above the candles. If the value happens to cross the candle cutting the specified number of pips from above (Number of points to switch), the current value of the Top Graph will be displayed in the following candle, but not after it. The Bottom Graph will start from the current candle.
Methods of use:
| 1. | When Flipit starts to be plotted below the price it’s time to buy. |
| 2. | When Flipit starts to be plotted above the price it’s time to sell. |
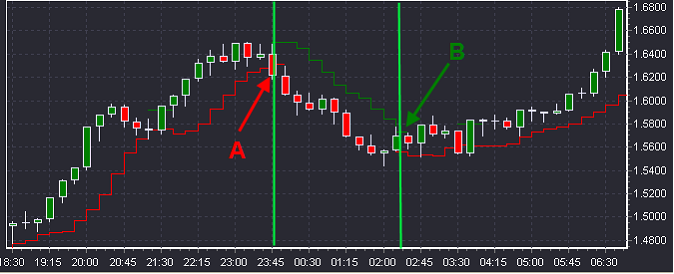
| 3. | The intersections of the indicator line with the chart graph give you entry and exit signals. For example, on the chart below you should open a trade at the point A and close it at the point B. |