Commodity Channel Index (CCI) is an oscillator that provides an indication of overbought or oversold markets. An instrument is deemed oversold when CCI goes below -100 and overbought when it exceeds +100. CCI measures the relationship between the asset's price, Moving Average, and deviations from the average.
CCI is mostly used to determine cyclical trends in commodity, equity and currency markets.
It identifies potential peaks and valleys of the asset's price and shows estimated changes in the direction of the asset’s price movement.
Methods of use:
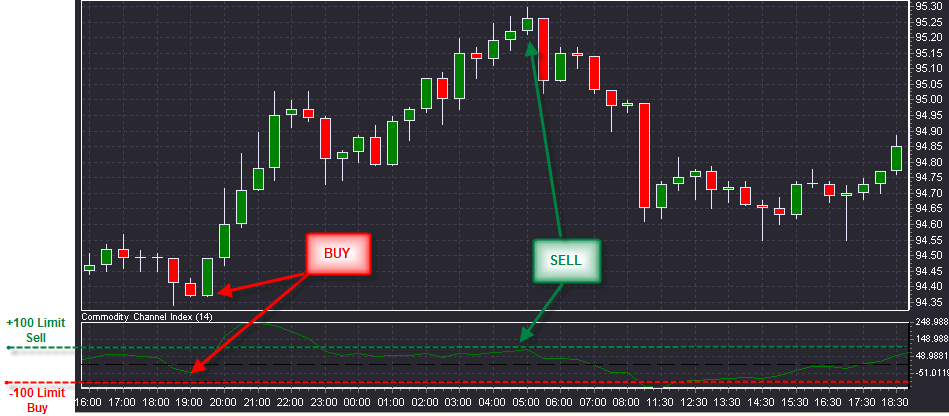
| 1. | Moves of CCI: When the CCI moves back above -100, it can be treated as a signal to buy. When the CCI moves back below +100, it can be treated as a signal to sell. |
| 2. | Divergence (when an indicator is trending in the opposite direction to the price): A positive divergence below -100 increases the strength of a signal based on a move back above -100. A negative divergence above +100 would increase the strength of a signal based on a move back below +100. |
| 3. | Indicators: An advance above -100 and trend line breakout show that an instrument is oversold and the trend can be treated as bullish. A decline below +100 and a trend line break show that a security is overbought and the trend can be treated as bearish. |