Auto Trendlines is an indicator which plots automatic trendlines based on the user defined parameters: Bars back to begin, Bars to calculate, Number of points to break.
The Bars to calculate parameter determines the period for the indicator calculation. The Bars back to begin parameter determines the number of the last candles (bars) in the chart, which will not be taken into account in the calculation process. The Number of points to break parameter determines how many points per candle the trendline may cross.
Two lines are plotted in the chart: the Uptrend line indicating the Support level and the Downtrend line indicating the Resistance level. They are displayed starting from the last candle in the chart, up to the left checkpoint of the trendline.
The UpTrend Line connects the lowest low in the period with the next lowest low in the period without penetrating any of the other candles in the period (it is allowed only in case if the number of points penetrated from below per candle is smaller then the specified ‘Number of points to break’). If any candle is penetrated, the next lowest low is taken instead.
The DownTrend Line connects the highest high in the period with the next highest high without penetrating any of the other candles in the period (it is allowed only in case if the number of points penetrated from above per candle is smaller then the specified ‘Number of points to break’). If any candle is penetrated, the next highest high is taken instead.
Note1: Sometimes either of lines cannot be plotted, since it is impossible to pick the second point for it without penetrating the candles.
Note2: Auto Trendlines are regarded as an indicator, and unlike the manually plotted trendlines, you cannot set alerts on them, change their names or drag them over the chart.
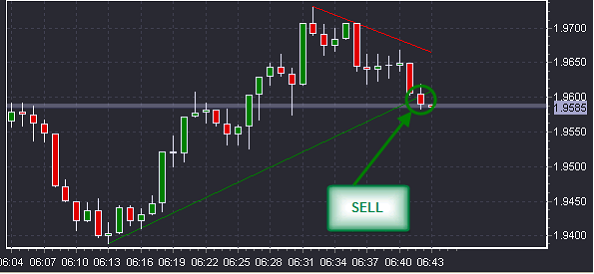
Methods of use:
The trendlines are widely used in technical analasys, helping to determine the general trend, support and resistance levels, and some of the chart patterns (e.g. Triangles). For example, two trendlines on the picture below represent the Symmetrical Triangle pattern. The last two candles penetrate the support line downwards - this breakthrough can serve as a signal to Sell, as such event may indicate the start of a strong downtrend.