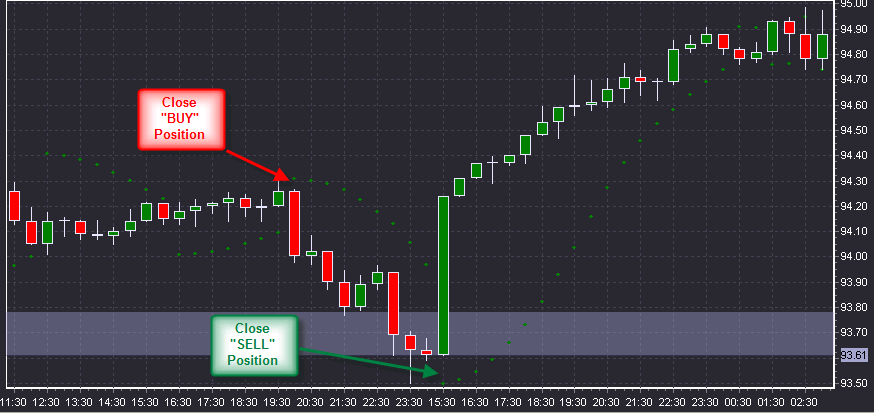
Parabolic SAR (stop-and-reversal) is an indicator used for analyzing trending markets. It has much in common with MA, but, unlike MA, Parabolic SAR moves with higher acceleration and may change its position in terms of the price. This is an ideal indicator for providing exit points.
Parabolic SAR is mostly used on the trending markets for the creation of closing orders and trailing stop orders. It is also used for defining the trend: if the parabola goes below the price line, the market is bullish; if the parabola goes above the price line, the market is bearish.
Methods of use:
| 1. | Long positions should be closed when the price falls below the SAR line. |
| 2. | Short positions should be closed when the price rises higher than the SAR line. |
| 3. | Each point of SAR defines the level of stop-order for the current & not the following trading period (day, hour, etc.). |
Note: This indicator is valid only for the trending markets; it is not useful in sideways phases.
