Moving Average Convergence/Divergence (MACD) is an indicator that follows the trend. It consists of a 12-period Exponential Moving Average (EMA, green), a 26-period Exponential Moving Average (navy), and a bar chart (red) that shows the difference between them. MACD is used when prices vary in the price corridor.
MACD is mainly used to identify three things: crossovers, overbought/oversold conditions, and divergences. Crossovers happen when the MACD falls below the signal line, which is a bearish signal (signal to sell). Conversely, when the MACD goes over the signal line, it is a bullish signal, (signal to buy). Overbought/oversold conditions happen when MA dramatically falls/rises from a longer Moving Average, which is a signal that the price is overextending and will soon return to more realistic levels. Divergence takes place when the price diverges from the MACD, which is a signal of the end of the current trend.
Methods of use:
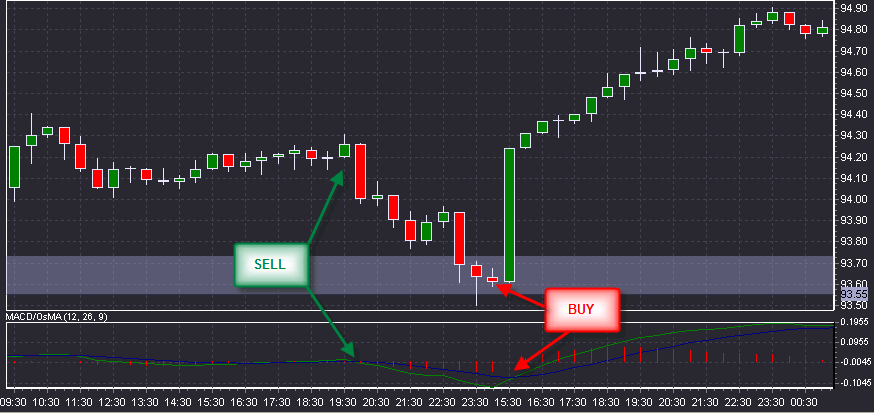
| 1. | When MACD is lower than the signal line, it is a signal to sell. |
| 2. | When MACD is higher than the signal line, it is a signal to buy. |
| 3. | MACD crossings over the zero line in either direction are used as signals to buy/sell. |
Note: It is advisable to wait for a confirmed cross over the signal line before entering into a position. This helps to avoid entering into a position too early.