Alligator is an indicator that consists of three Moving Averages with different numbers of bars for smoothed MA. The blue line (Alligator jaw) is a Balance Line for the timeframe that was used to build the chart (13 bar smoothed average offset by 8 bars). The red line (Alligator teeth) is also a Balance Line, but a level lower than the blue one (8 bar smoothed average offset by 5 bars). The green line (Alligator lips) is also a Balance Line, a level lower than the red one (5 bar smoothed average offset by 3 bars).
The Alligator is mostly used to determine the presence/absence of the trend and its direction. It can also be used together with Eliot waves: if the price is outside the Alligator’s mouth, an impulse wave is being formed; if it is inside the Alligator’s mouth, a correcting line is being formed.
Methods of use:
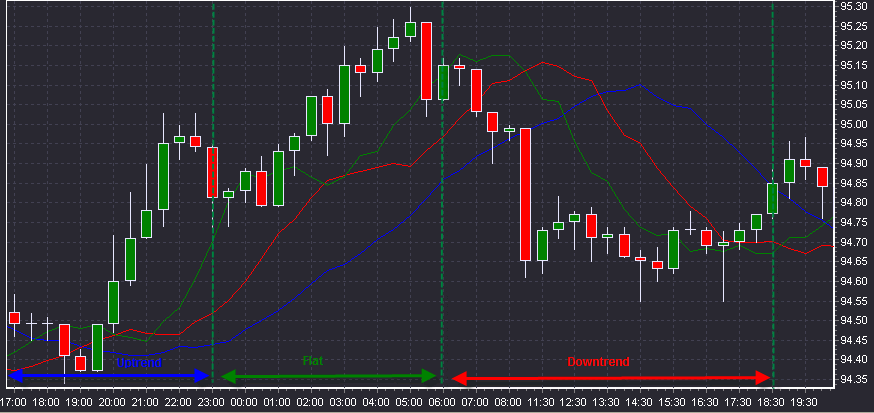
| 1. | When the blue, red, and green lines are crossed or intertwined, there is a flat market; the Alligator is sleeping. The longer this period, the more the market will move after. |
| 2. | When all three lines are not crossed or intertwined and the price is above the Alligator’s mouth, there is an uptrend in the market. At this period the Alligator is awake and hunting. |
| 3. | When all three lines are not crossed or intertwined and the price is under the Alligator’s mouth, there is a downtrend in the market. At this period the Alligator is also awake and hunting. |
| 4. | When the lines are crossed or intertwined, it means that the market is flat again. At this period the Alligator is full and it is time to fix the profit. |