There are three required procedures: Init, Add and Recalculate.
4.1. The Init Procedure
After declaring the constant and variables, we create the Init procedure. This procedure creates the indicator graph as an object and sets up its parameters.
| 1. | Creating the Indicator graph as an object. |
Let’s assume that our indicator is a line graph called MyIndicator. Therefore procedure Init should contain following code:
MyIndicator:= TLineGraph.Create(); |
It is important that the type of the graph you create is the same type as you declare (in the Variables creation section).
| 2. | Color settings |
In procedure Init you set up indicators color(s). By default (if you do not specify any particular color) your indicator will be green. To set up your desired color you need to include the following code:
MyIndicator.Color := clBlue; |
In this particular example we are using BLUE. In a table below you can see codes for different colors.
|
|
|
|
|
|
|
|
|
|
|
|
|
|
|
|
| 3. | Zero Line (X-axis) setting |
This setting applies only for histogram charts (TVolumeGraph). If this setting is not used then the minimal value of vertical scale in histogram will be the same as the minimal value of the histogram while the maximum value of the vertical scale will be the same as the maximal value of the histogram. When the chart is scrolled horizontally, the vertical scale will automatically adjust to show the min/max values of the indicator.
If you want the indicator bar to be drawn upward and downward from the X-axis, you will need to add the following code to the Init procedure.:
MyIndicator.UseYOrigin := True; //specifies that the indicator will use a custom axis
MyIndicator.YOrigin := 0; // Specifies that the X-axis will intersect the Y-axis at point 0 (on Y-axis). |
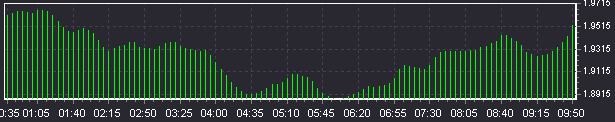
Example: You want to create an indicator that will show the difference between the closing prices of the current and previous candle. It is obvious that some of the values will be positive are others negative. If you don’t use a fixed starting point for the Y-axis then your indicator will appear as follows:
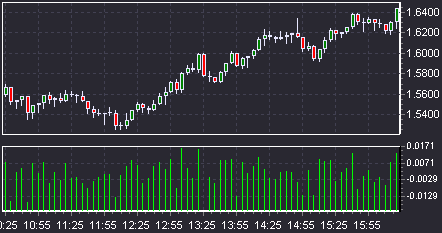
If, on the contrary, you do use the 0 starting point for the Y-axis, then your indicator will appear as shown below:
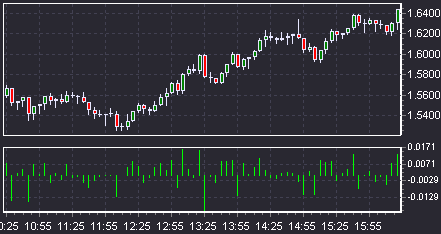
Many indicators use the same approach, including Accelerator/Decelerator, Awesome Oscillator, MACD/OsMA and others.
| 4. | Indicator name Setting |
It is also possible to create an indicator name/title that will be shown when the indicator is displayed in a dedicated section of the chart (Separated). To do so, we use the function SetTitle(Title:String). For example, to display the title 'My Own Indicator’ over the indicator section we need to add the following code:
SetTitle(‘My Own Indicator’); |
Utilizing the abovementioned functions, the Init procedure may look as follows:
Example 1: Case when Y-axis setting is not used
procedure Init; begin MyIndicator:= TPointGraph.Create; MyIndicator.Color:=clYellow; end; |
Example 2: Case when Y-axis setting (0) is used
procedure Init; begin MyIndicator:= TVolumeGraph.Create; MyIndicator.Color:=clBlack; MyIndicator.UseYOrigin := True; MyIndicator.YOrigin := 0; end; |
Example 3: Case when the indicator consists of a line graph and a histogram with a Y-axis setting (5)
procedure Init; begin MyIndicator1:= TLineGraph.Create; MyIndicator1.Color:=clYellow; MyIndicator2:= TVolumeGraph.Create; MyIndicator2.Color:=clOlive; MyIndicator2.UseYOrigin := True; MyIndicator2.YOrigin := 5; end; |
4.2. The Recalculate Procedure
The Recalculate and Add procedures (regardless of order) come after the Init procedure. The Add procedure contains an algorithm that is used in calculation of indicator value at an individual candle. The Recalculate procedure goes through all candles and applies the Add procedure individually to each one.
Before drawing the recalculated indicator, the chart must be cleared. To do so we use the command: MyIndicator.Clear (where MyIndicator is the name of the indicator as you previously declared/created).
Example: let’s assume that your indicator has three graphs with the following names: Signal_Line, MA_Line, and Signal_Vol. The first lines of code in the Recalculate procedure should be:
Signal_Line. Clear; MA_Line.Clear; Signal_Vol.Clear; |
There are two ways to apply the Add procedure to every candle in the chart. The first one is to use a cycle:
for i := 0 to SourceGraph.Count - 1 do begin Add(i); end; |
The second way is to use the command AddAllValues. It works in the same way as above cycle.
There is also FullRecalculation, which clears all indicators and performs complete re-calculation of indicators.
Hence it is possible to recalculate and redraw indicators in three different ways:
First way:
procedure Recalculate; begin Graph.Clear; for i := 0 to SourceGraph.Count - 1 do begin Add(i); end; end; |
Second way:
procedure Recalculate; begin Graph.Clear; AddAllValues; end; |
Third:
procedure Recalculate; begin FullRecalculation; end; |
Each of the three ways accomplishes the same result.
4.3. The Add Procedure
The Add procedure calculates the individual value of the indicator and plots it on the chart. Most indicators are based on past rates/candle values. Often indicators use some form of average to smooth out market rates
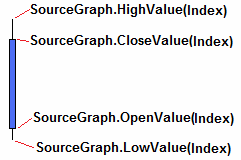
Let’s consider various candles parameters that can be used in indicator calculations. There are 6 of these:
| 1) | SourceGraph.OpenValue(Index) – Return Open rate for the candle with given Index |
| 2) | SourceGraph.CloseValue(Index) – Return Close rate for the candle with given Index |
| 3) | SourceGraph.HighValue(Index)– Return Max rate for the candle with given Index |
| 4) | SourceGraph.LowValue(Index) – Return Min rate for the candle with given Index |
| 5) | SourceGraph.XValue(Index) – Returns number of the candle with given index |
| 6) | SourceGraph.YValue(Index) – Returns value of the candle with given index |
| 7) | SourceGraph.DateTime(Index) – Returns the date and time when the candle with given index opened |
Index is a sequential number given to and uniquely identifying each candle. Index numbers start with 0 for the leftmost candle and increase by 1 for each consecutive candle. Using the index number we can access any individual candle on the chart.
To plot the indicator’s value on the chart we use method AddXY(x,y:Double) where x and y are coordinates for the indicator’s value in the chart.
Example 1: let’s create an indicator that will measure candle height (High-Low) and display restulting values in a separate section of the chart window. The Add procedure will appear as follows:
procedure Add(const Index: Integer); begin MyIndicator.AddXY(SourceGraph.XValue(Index), SourceGraph.HighValue(Index) - SourceGraph.LowValue(Index)); end; |
Example 2: let’s create a Simple Moving Average indicator with a period of 14.
For that we will need to create a couple of additional variables:
| 1) | sma – a temporary variable designed to store the average. |
| 2) | i – an integer variable used to keep count of the cycle. |
Var sma: Double; i: Integer; |
procedure Add(const Index: Integer); begin sma:=0; //reset variable for i:= 0 to 13 do sma:=sma+ SourceGraph.CloseValue(Index-i) //Sum of the closing rates of 14 candles sma:=sma/14; //Получаем среднее MyIndicator.AddXY(SourceGraph.XValue(Index), sma); //Plot received value of sma
end; |
|
Example 3: let’s create a script that will display the date and time when the last candle on the chart opened.
The Add procedure will appear as follows:
procedure Add(const Index: Integer); begin if ValueIndex=SourceGraph.Count-1 then ShowMessage(DateTimeToStr(SourceGraph.DateTime(ValueIndex))); end; |
4.4. Example of the entire script
Most popular indicators can be created by using only required functions. Below you can find a script example which exhibits the correct order of procedures and their use.
Const // declaration of Constants IndicatorName = 'Test Script'; //Indicator Name as it will appear in the list of user indicators Layout = Separated; // Indicator layout type
Var // Declaration of Variables Graph: TVolumeGraph; //Declaring the object Graph of class type TLineGpagh (Line Chart)
procedure Init; // Procedure of the initialization of the indicator begin Graph := TVolumeGraph.Create; //Creating Graph object Graph.UseYOrigin := True; Graph.YOrigin := 0; //Setting up indicator’s X-axis end;
procedure Add(const Index: Integer); //Procedure of adding and plotting an indicator’s point onto the chart begin SetTitle('My Own Indicator') ; // Indicator Title as it will appear in the chart body if Index > 0 then Graph.AddXY(SourceGraph.XValue(Index), SourceGraph.OpenValue(Index) - SourceGraph.CloseValue(Index)); //Plotting an indicator’s point end;
procedure Recalculate; //Procedure of recalculating all the indicator’s points begin FullRecalculation; end; |