Optional procedures can be used to gain additional capabilities and flexibility in executing your scripts.
5.1. The CreateSettings Procedure
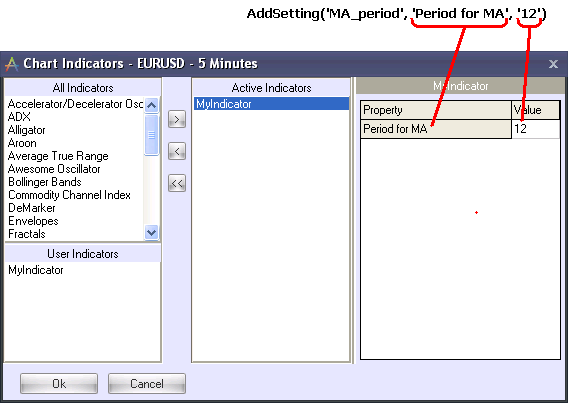
This procedure allows you to configure script variables (time period) and parameters (color) when you are adding an indicator to a chart (in the indicator setup dialog box). In the body of the script, this procedure should be placed after the declaration of constants and variables (before the Init procedure).The CreateSettings procedure contains a number of AddSetting procedures. AddSetting procedures, in turn, must be used in order to apply each variable and/or parameter entered by the user when setting up the indicator. Let’s consider the following example where we add the variable 'MA_period':
AddSetting('MA_period', 'Period for MA', '12'); |
Where:
| 1) | 'MA_period' – name of the variable that we use in the script. This variable will be assigned whatever value the user enters for it during indicator setup. |
| 2) | 'Period for MA' – The name for this variable as it will be shown in the indicator setup dialog box. |
| 3) | '12' is the default value for the variable. |
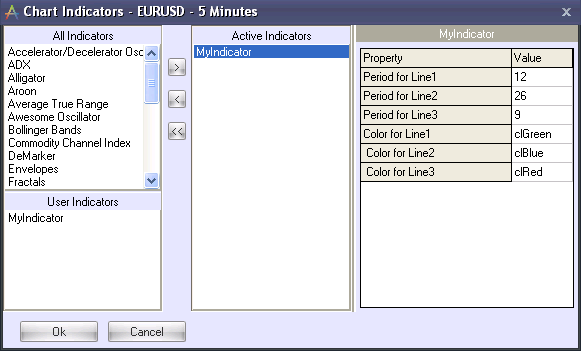
Example: Let’s assume that there are three lines in your indicator. We want to be able to set colors and time periods for each line. The first line should have a default period of 12 and the color green, the second line should have a default period of 26 and the color blue, and the last line should have a default period of 9 and the color red. To achieve this, the CreateSettings procedure should contain the following code:
procedure CreateSettings; begin AddSetting('Line1_period', 'Period for Line1', '12'); AddSetting('Line2_period', 'Period for Line2', '26'); AddSetting('Line3_period', 'Period for Line3', '9'); AddSetting('Line1_color', 'Color for Line1', 'clGreen'); AddSetting('Line2_color', ' Color for Line2', 'clBlue'); AddSetting('Line3_color', ' Color for Line3', 'clRed'); end; |
As a result, the indicator setup dialog box will look as follows when you select your custom indicator:
All variable that are used in AddSetting are of string type.
5.2. The ApplySettings Procedure
The ApplySettings procedure is executed every time you change the indicator’s settings in the Indicator setup dialog box. To apply an individual setting we use the function GetSetting(‘Value'), where ‘Value’ is the name of the variable to which we assigned a value in the AddSetting function.
5.2.1. Setting up colors
Let’s consider how color settings are applied. As previously described, the color of an indicator is set in the Init procedure.
Examle: Our indicator is called MyIndicator.
Var MyIndicator: TLineGraph; |
In order to be able to change the indicator’s colors in the indicator set up dialog box, you must add the following code in the Create Settings procedure:
procedure CreateSettings; begin … AddSetting('Indicator_color', 'Color for MyIndicator', 'clRed'); … end |
Later, the ApplySettings procedure should contain the following code:
procedure ApplySettings; begin … MyIndicator.Color := StrToColor(GetSetting('indicator_color')); … end; |
The variable ‘indicator_color‘ is of the string data type, and must therefore be converted to color data type. In order to do so we use the function StrToColor(Value) where ‘Value’ is the string variable that we convert to color.
5.2.2. Period Settings
Let’s see how various data types can be converted using the following functions:
function IntToStr(i: Integer): String |
Convert Integer to String |
function FloatToStr(e: Extended): String |
Convert Floating to String |
function DateToStr(e: Extended): String |
Convert Date to String |
function TimeToStr(e: Extended): String |
Convert Time to String |
function DateTimeToStr(e: Extended): String |
Convert Date and Time to String |
function StrToInt(s: String): Integer |
Convert String to Integer |
function StrToFloat(s: String): Extended |
Convert String to Floating |
function StrToDate(s: String): Extended |
Convert Date to Floating |
function StrToTime(s: String): Extended |
Convert Time to Floating |
function StrToDateTime(s: String): Extended |
Convert date and Time to Floating |
function StrToColor(const HexRGB: String): TColor |
Convert String to Color |
The SetTitle procedure can be placed inside the ApplySettings procedure (but in that case it should not be present inside the Add procedure). It can be quite useful when you want to show indicator parameters (along with indicator’s title/name) in the chart body, especially when observing indicator behavior across various instruments and time intervals.
Let’s consider the usage of the CreateSettings and ApplySettings procedures in the following somewhat more complex example.
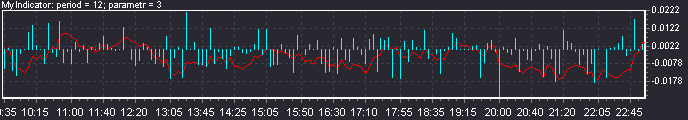
Example: We need to create an indicator consisting of a line and a histogram. The histogram will show the difference between the opening and closing rates for each candle. The histogram will have a 0 origin for its Y-axis. The line will show a moving average of the histogram’s values multiplied by a variable (parameter). The moving average period will be set in indicator settings. Default values will be as follows:
| 1) | line_period = 12; |
| 2) | parameter = 3; |
| 3) | line_color = clRed |
| 4) | histogram_color = clBlue |
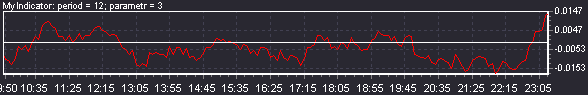
This indicator will be shown in a dedicated section of the chart along with the period and parameter values.
Const IndicatorName = 'MyIndicator'; // Indicator’s name Layout = Separated; // Show indicator in a separate section of the chart
var Line: TLineGraph; // Declare Line graph Histogramm:TVolumeGraph; // Declare Histogram graph sma: real; // Declare rest of variables period, i: Integer; parametr:Double;
procedure CreateSettings; // Create setting that can be adjusted in the indicator setup dialog box begin AddSetting('line_period', 'Period for Moving Average', '12'); //MA Period setting AddSetting('parametr', 'Parametr (Integer)', '3'); //Parameter setting AddSetting('line_color', 'Line Color', 'clRed'); //Line color setting AddSetting('histogramm_color', 'Histogramm Color', 'clAqua'); //Histogram color setting end;
procedure ApplySettings; //Apply Settings begin Period := StrToInt(GetSetting('line_period')); //Apply MA period setting Histogramm.Color := StrToColor(GetSetting('histogramm_color')); //Apply histogram color setting Line.Color := StrToColor(GetSetting('line_color')); //Apply line color setting Parametr := StrToFloat(GetSetting('parametr')); //Apply parameter setting SetTitle('MyIndicator: period = ' + GetSetting('line_period') + '; parametr = ' + GetSetting('parametr')); //Create indicator title end;
procedure Init; //initialize indicator begin Line := TLineGraph.Create(); //Create line graph Histogramm:=TVolumeGraph.Create(); //Create histogram graph histogramm.UseYOrigin:=True; //Set 0 Y-axis for histogram histogramm.YOrigin:=0; end;
procedure Recalculate; //Recalculate indicator values begin FullRecalculation; end;
procedure Add(const Index: Integer); //Add a new value to the indicator begin mysma:=0; //Reset variable sma for i:= 0 to (period-1) do mysma:=mysma+SourceGraph.OpenValue(Index - i)- SourceGraph.CloseValue(Index-i); mysma:=mysma/period; //Calculate average difference between open and close rates within specified // period (mysma) Line.AddXY(SourceGraph.XValue(Index), mysma*parametr); //Create a dot in a line graph equal to the value of mysma multiplied by parameter Histogramm.AddXY(SourceGraph.XValue(Index), SourceGraph.OpenValue(Index)- SourceGraph.CloseValue(Index)); //Calculate and add new value to histogram graph end; |
You can see a possible result in the picture below:
5.3. The Draw Procedure
This procedure enables the user to add supplementary lines on the chart. For example, the indicator Stochastic utilizes 2 horizontal lines at 20% and 80% levels. In order to create such lines in charts, we use the Draw procedure.
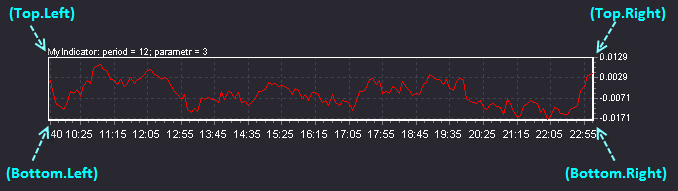
In order to position supplementary lines, we must calculate their positions relative to four corners of the chart window (Top, Bottom, Right, Left). When we display an indicator in a dedicated section of the chart window (separated), we use the four corners of that separate section rather than the main chart.
5.3.1. Supplementary Lines
In order to add supplementary lines to the indicator we use the function Cnvas.Line(x1,y1,x2,y2) where x1y1 andx2y2 are starting and ending coordinates for the line. For example assume that we need to draw a horizontal line in the middle of the chart. In this case the Draw procedure will contain the following code:
procedure Draw; var Height, Y: Integer; begin Height := Bottom - Top; Y := Bottom - Round(0.5 * Height); Canvas.Line(Left, Y, Right, Y); end; |
Below you can see the resulting chart window:
The function Calvas.LineTo(X,Y) allows you to draw sections of the line.
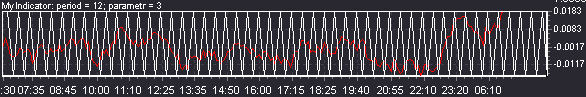
For example let’s draw zigzag line across the entire area of the chart. One of many possible ways is presented below:
procedure Draw; var Height, Y, i: Integer; begin Height := Left - Right; for i:= 1 to 100 do begin if frac(i/2)=0 then begin Y := Left - Round(i/100 * Height); Canvas.LineTo(Y, Bottom); end else begin Y := Left - Round(i/100 * Height); Canvas.LineTo(Y, Top); end; end; end; |
You can see the resulting chart below:
5.3.2. Color Settings
In order to manage the color of the lines we use the function Canvas.Pen.Color . For example, to color the line red, we add following command:
Canvas.Pen.Color := clRed; |
If you need to use different colors for different lines within the same chart, you must set their colors before each line is drawn.