7.0 Moving Averages
There are two ways to use Moving Averages . The first (simple) one is to use function SMA(Period,ValueIndex) and EMA(Period,ValueIndex). The second one is to use so called Statistics (described later in this document).
Function SMA(Period, ValueIndex).
Function SMA(Period, ValueIndex) returns value of indicator Simple Moving Average for the given Period. Calculation of Indicator starts with a candle with a number ValueIndex and ends on a candle with a number (ValueIndex-Period). For example function SMA(14,SourceGraph.Count()-1) would return value Simple Moving Average starting from the last candle with period 14.
Function EMA(Period, ValueIndex).
Function EMA(Period, ValueIndex) returns value of indicator Exponential Moving Average for the given Period. Calculation of Indicator starts with a candle with a number ValueIndex and ends on a candle with a number (ValueIndex-Period). For example function EMA(14,SourceGraph.Count()-1) would return value Simple Moving Average starting from the last candle with period 14.
7.1. Statistics
Unlike SMA and EMA, Statistics can process not only candles’ values but also any other values entered by user. For example Statistics are convenient to calculate moving average of difference of values of two indicators.
If you intend to use statistics in the script, you must first declare variable of the type TSMAStatistics (simple moving average) or TEMAStatistics (exponential moving average). See example below:
Var SimMA: TSMAStatistics; EimMA: TEMAStatistics; |
Furthermore in the Init procedure you must create objects of classes TSMAStatistics and TEMAStatistics and set their periods. Let’s assume that we will use a period of 10 for SimMA and 14 for ExMA. The resulting Init procedure will contain the following code:
procedure Init; begin …
ExMA := TEMAStatistics.Create; SimMA := TSMAStatistics.Create; ExMA.Period := 14; SimMA.Period := 10; … End; |
To reset values of SimMA and ExMA, use following code in procedure Recalculate:
procedure Recalculate; begin ...
ExMA.Clear; SimMA.Clear;
… end; // Recalculate |
If you need to calculate SimMA or ExMA using alternative data (other than candles) then you would have to populate arrays with values. To do that we use function AddValue(Value). For example let’s assume that we want to populate SimMA with candle open rates and ExMA with candle high rates:
ExMA.AddValue(SourceGraph.OpenValue(Index)); SimMA.AddValue(SourceGraph.HighValue(Index)); |
We use function GetValue(Index) to obtain indicator’s value for candle with an specified index.
b:= ExMA.GetValue(Index); a:= SimMA.GetValue(Index); |
This way usage of Statistics simplifies calculation of moving averages. Using Statistics, script calculating moving average will look as follows:
const IndicatorName = 'Script: Simple Moving Average 1'; // Indicator’s name Layout = Embedded; // This indicator will be plotted directly on the chart
var Graph: TLineGraph; // Declare Line Chart type SMA: TSMAStatistics; // Declare Statistic
procedure Init; //Initialize indicator begin Graph := TLineGraph.Create; //Create Line Chart Graph.Color:=clYellow; // Setting up indicator color SMA := TSMAStatistics.Create; //Create Statistics SMA.Period := 14; // Set Up period for moving average end;
procedure Add(const Index: Integer); // Add a new value to the indicator begin SMA.AddValue(SourceGraph.YValue(Index)); // Add a new value of candle’s closing to the indicator if SMA.HasValue(Index) then Graph.AddXY(SourceGraph.XValue(Index), SMA.GetValue(Index)); end; //Plot new value of indicator onto chart
procedure Recalculate; //Full recalculation begin FullRecalculation; end; |
7.2 Using Past Values
In addition to the SourceGraph values and Statistics, you can also use the past values of the indicators lines themselves, when calculating the future values. You can refer to these values in the same way as to the values of the SourceGraph:
NameOfTheLine.YValue(Index) |
Example: let’s create a script that will draw an increasing line:
Const IndicatorName = 'PastValues'; Layout = Separated;
var Ind: TLineGraph; t: Integer;
procedure Init; begin Ind := TLineGraph.Create(); t:=0; end;
procedure Recalculate; begin FullRecalculation; end;
procedure Add(const ValueIndex: Integer); begin if (t=0) then begin Ind.AddXY(SourceGraph.XValue(ValueIndex), 0); t:=1; end;
if (t<>0) then begin Ind.AddXY(SourceGraph.XValue(ValueIndex), Ind.YValue(ValueIndex-1)+1); end; end; |
7.3. Setting up the vertical Scale
It is possible to limit the dimensions of the vertical scale of an indicator. If such a limitation is not used, then the indicator scale will be adjusted automatically to include the min and max values of the indicator. The function SetYScale(const MinValue, MaxValue: Double) is used to create a fixed scale. For example, to use a scale from 0 to 1, the Init procedure should contain the following code:
procedure Init; begin … SetYScale(0,1); … end; |
7.4. Message notification
When writing indicators, it is possible to output message notifications. For example, they can be used as a cue for opening a new position. In order to do this, use the function ShowMessage(String).
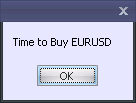
Example: To generate the message ‘Time to buy EURUSD’, the fuction will appear as follows:
ShowMessage('Time to Buy EURUSD’); |
Resulting message:
7.5. Sound notification
You can use sound notifications in your script. An audio file will be played every time when some event takes place. In order to do this, use the function PlaySound(const FileName: String).
Example: To hear the audio file Notify.wav from the directory E:\MySounds, the function will appear as follows:
PlaySound('E:\MySounds\Notify.wav'); |
Note:
1) If you are using this function, the Silent Mode in the WinClient settings should be turned off. Otherwise you will not hear any sounds.
2) The name of the used directory should contain only Latin letters.
3) The file should be in the .wav format.