3.1. Declaration of Constants.
Each Indicator script should contain at least two constants:: IndicatorName and Layout.
| • | IndicatorName determines the name under which the indicator will be shown in the user indicator list. This value must be denoted in single quotation marks. Make sure that you do not use the same name for different indicators. |
| • | Layout determines indicator placement within the chart. It can have two values: Embedded or Separated |
| o | Embedded indicator will be placed directly in the main chart window. |
| o | Separated will be placed in a separate/dedicated section of the chart and will have its own vertical scale. |
Other Constants may be used when necessary.
Therefore the first few lines of script will look as follows:
Const IndicatorName = 'My Indicator'; Layout = Separated; |
3.2. Declaration of Variables.
Variables are declared after Constants. The following are the available types of variables:.
Type |
Description |
Byte, Word, Integer, Longint, Cardinal, TColor |
Integer data types. |
Boolean |
Logical: YES/NO. |
Real, Single, Double, Extended, Currency, TDateTime |
Floating Data types. |
Char |
Character data type. |
String |
String Data type. |
TChartGraph |
Base chart class. |
TLineGraph = class(TChartGraph) |
Line chart. |
TPointGraph = class(TChartGraph) |
Point Chart. |
TOHLCGraph= class(TChartGraph) |
OHCL (Open, High, Close, Low) financial chart. |
TVolumeGraph = class(TChartGraph) |
Histogram chart. |
TChartStatistics |
Base Statistics class. |
TSMAStatistics = class(TChartStatistics) |
Statistics moving average |
TEMAStatistics = class(TChartStatistics) |
Statistics exponential moving average |
Declaration of Arrays
Please note, that it is not possible to use dynamic arrays in the Indicator Script. For instance, if you use the line:
Ar: array [0..SourceGraph.Count-1] of Double; |
this will result in an error. If you need a dynamic array, you should declare an extensible array, and use the SetLength Function.
Example: We need to assign the close values of the candles on the chart to the array. We need the following lines:
procedure Add(const ValueIndex: Integer); |
In order to draw an indicator in a chart, you have to declare a variable that will be one of the following data types: TLineGraph, TPointGraph, TVolumeGraph (depending on the type of indicator you want to draw). Let’s assume that you want to draw a line indicator called MyIndicator . The variable declaration section should have following code:
Var MyIndicator: TLineGraph; |
3.3. Types of Indicators
Indicator can have the following forms: line (TLineGraph), collection of dots/points (TPointGraph), or histogram (TVolumeGraph). Each type can be shown in a separate chart section with its own scales (Separated) or can be imposed over the chart body (Embedded).
Bellow you can find examples of how this may look:
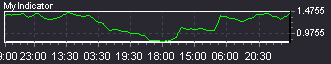
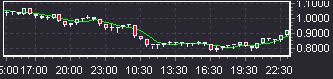
| 1) | TLineGraph- Line Chart |
Separated:
Embedded:
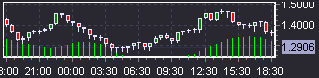
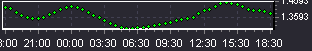
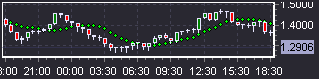
| 2) | TPointGraph – Dot/Point Chart |
Separated:
Embedded:
| 3) | TVolumeGraph – Histogram Chart |
Separated:
![]()
Embedded: