To open the user indicator editor, go to the main application menu => Charts => User Indicators Editor. The User Indicators Editor has the following interface:
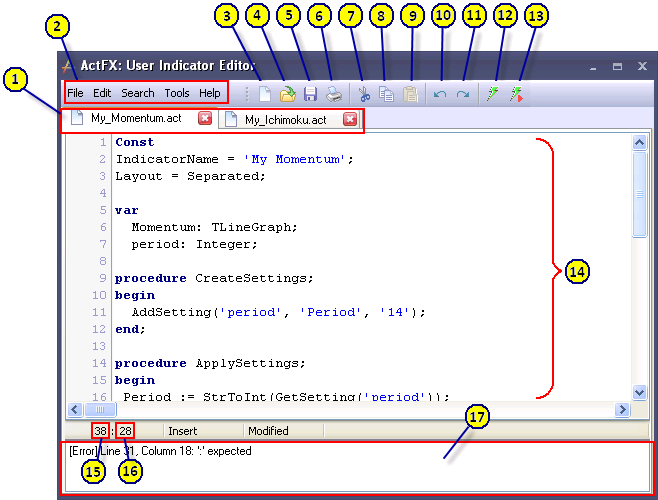
| 1) | Script tabs, which allow you to switch between the opened scripts |
| 2) | The Editor menu |
| 3) | Create a script |
| 4) | Open a script |
| 5) | Save the script |
| 6) | Print the script |
| 7) | Cut the selected text |
| 8) | Copy the selected text |
| 9) | Paste from the clipboard |
| 10) | Undo |
| 11) | Redo |
| 12) | Compile the script |
| 13) | Compile the script and Add it to the List of User Indicators or Update it |
| 14) | Current script |
| 15) | Vertical cursor position in the editor (line #) |
| 16) | Horizontal cursor position in the editor (column #) |
| 17) | Debugger. |
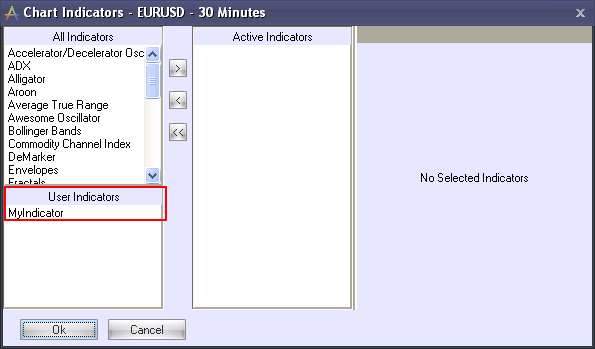
To start working in the User Indicator Editor either click on File=>New , or open an existing script file by selecting File => Open (or alternatively by pressing on![]() button). When you finish and compile your script you will need to export it by pressing Tools => Add Current to User Indicators. After that you will be able to see your indicator in the Chart Indicator Set-up window in the User Indicators section.
button). When you finish and compile your script you will need to export it by pressing Tools => Add Current to User Indicators. After that you will be able to see your indicator in the Chart Indicator Set-up window in the User Indicators section.
If you wish, you can also hide the script when compiling the indicator. You can create a file with the extension .actc, and use it in the same way as a file with the extension .act, however it will not be possible to open such a file from the Indicator editor to see or edit the script. This opportunity allows you to share the indicators you created reserving your copyright.
You can create a file with the extension .actc by selecting File => Save as compiled.
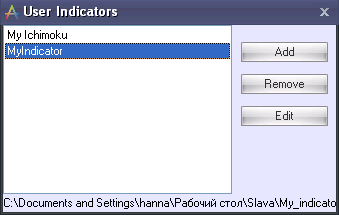
You can manage existing scripts by opening the List of User Indicators (Tools => List Of User Indicators). There you can see all currently added indicators, add or remove indicators, or open an indicator script for editing.
Before you can use your script, you will need to compile it. To do so, select Tools=>Compile Current (or press the ![]() icon or the F9 key). If the script contains no programming syntax errors, you will receive a “Compiled successfully” message in the debugger section. If some error(s) were found, the debugger section will show the type of error and its location in the script.
icon or the F9 key). If the script contains no programming syntax errors, you will receive a “Compiled successfully” message in the debugger section. If some error(s) were found, the debugger section will show the type of error and its location in the script.
In order to compile the indicator and make it immediately available in charts, select Tools=> Compile And Apply, (or press the ![]() icon or Ctrl+F9).
icon or Ctrl+F9).
Example: Let’s add an indicator which will be shown on the main body of the chart. This indicator will form a line connecting the candles’ closing rates. We will need to go through the following steps:
1) Open the User Indicator editor: Charts => User Indicators Editor.
2) Open a new script page: File => New.
3) Write/create the script:
Const // Declaration of constants IndicatorName = 'Test Script'; //Indicator’s name as it will appear in User Indicators List Layout = Embedded; // This indicator will be plotted directly on the chart
Var // Declaration of variables Graph: TLineGraph; //Declare Chart type variable //line indicator
procedure Init; // Initialization procedure begin Graph := TLineGraph.Create; //Creation of line Indicator end;
procedure Add(const Index: Integer); //procedure of adding indicator onto chart begin if Index > 0 then Graph.AddXY(SourceGraph.XValue(Index),SourceGraph.YValue(Index)); //Drawing the indicator end;
procedure Recalculate; //procedure of recalculation of indicator’s values. begin FullRecalculation; end; |
4) Save the entered script : File => Save or click the ![]() icon (don’t forget to name your file).
icon (don’t forget to name your file).
5) Compile your script: Tools => Compile Current or click the ![]() icon.
icon.
6) Provided that there were no errors during compilation, export the indicator : Tools => Add Current to User Indicators.
7) In a chart window open the indicator setup dialog and select 'Test Script' from the list of user indicators.
9) Click OK. The indicator will appear in the chart window.