In order to run a strategy, it has to be present in the Strategy List. Go to Main Menu ->ActFX -> Strategy List, or press the 'Launch Strategy' button (![]() ) on the Tools Toolbar. Choose a strategy and click 'Run'.
) on the Tools Toolbar. Choose a strategy and click 'Run'.
You can also run your strategy by clicking the 'Run Strategy' button on the Strategy Editor toolbar (![]() ).
).
Note: Clicking 'Run' will not start the strategy right away. It will open the Strategy window,where you can modify the strategy settings or use the default ones, and launch the strategy by clicking 'Start Strategy'.
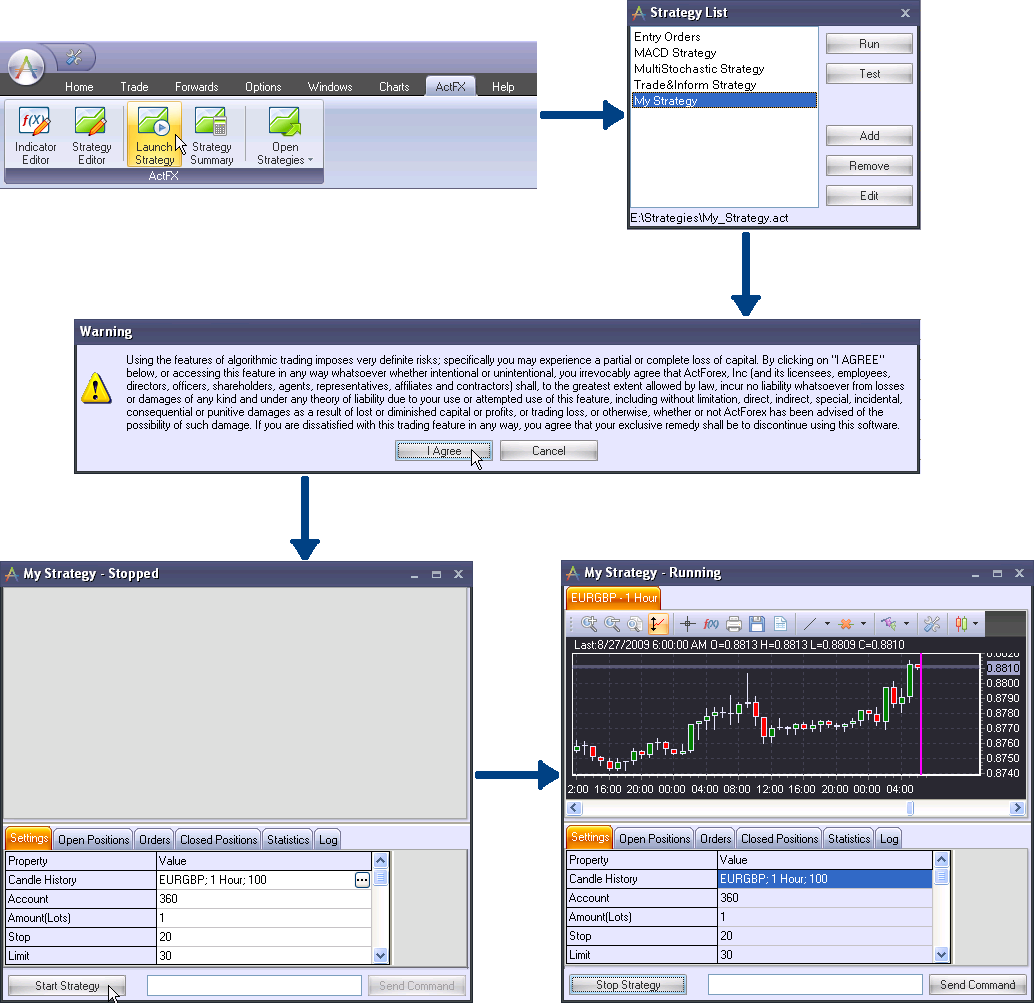
Please note: If you exit the WinTrader, or close the window of a started strategy, the strategy will be stopped.
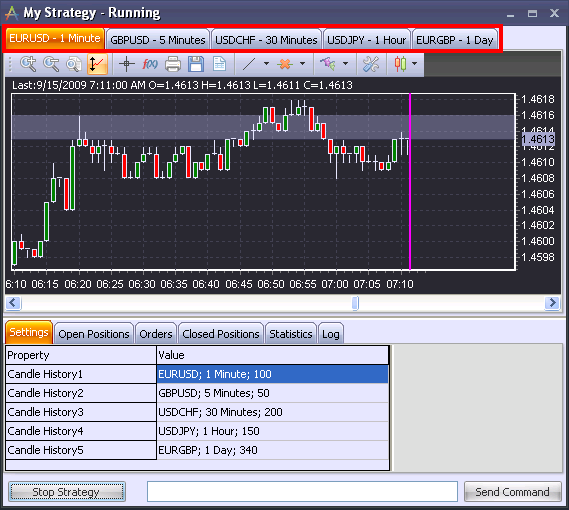
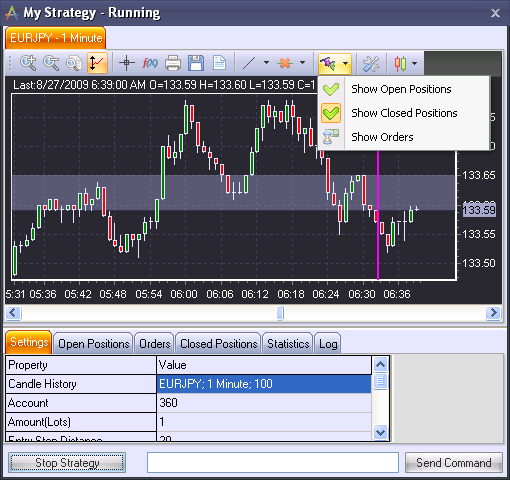
You can see an example of a started strategy in the picture above. The window includes chart(s) of the used instruments and 6 tabs:
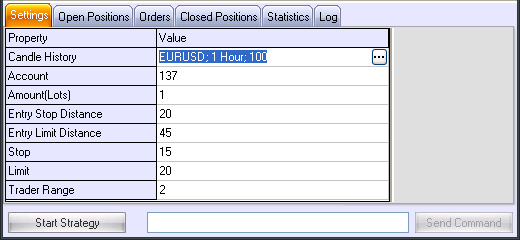
1) Settings – the parameters of the strategy
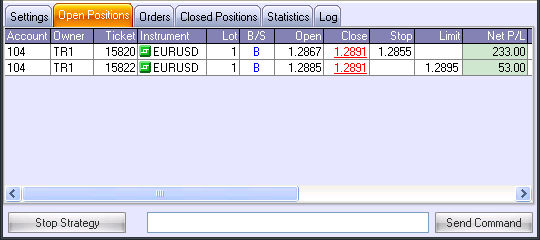
2) Open Positions – the currently open positions created by this particular strategy
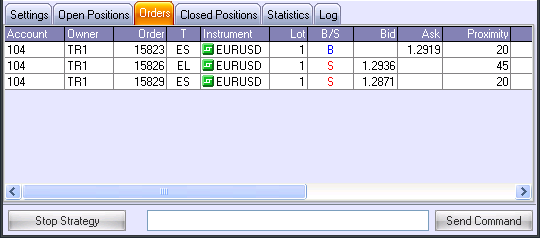
3) Orders – the outstanding orders created by this particular strategy
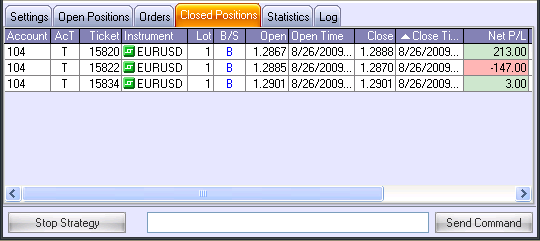
4) Closed Positions – the positions opened and closed by this particular strategy
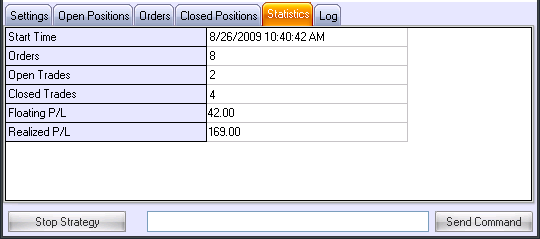
5) Trading Statistics – the statistics of the strategy
6) The internal log – used to output system and script generated messages
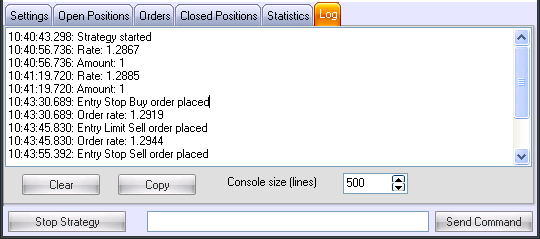
Please make note of the Log tab. You can output your own records in this tab, by using the Log() function. For instance, you want to output the word 'Hello' in the Log tab. Your script has to include the following line:
Log(‘Hello’); |
As a result, you will see the following record in the Log tab:
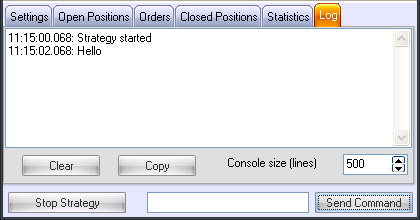
Please note:
1) Some records in the Log are made automatically, such as 'Strategy Started', 'Strategy Stopped', and various errors which stop the started strategy.
2) The time displayed in the log is the time shown in the WinTrader Application – not the time set on your computer.
If you are using several charts in your strategy, each chart will be displayed in a separate tab:
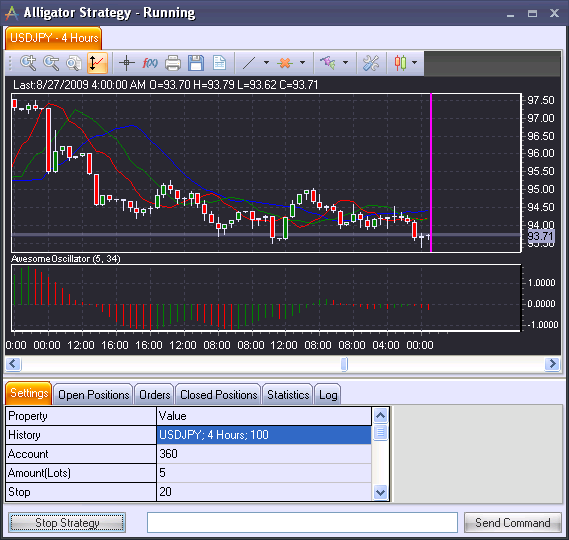
If you are using any indicators in your strategy, they will also be displayed on the chart(s):
The chart toolbar in the window of a started strategy contains the following buttons:
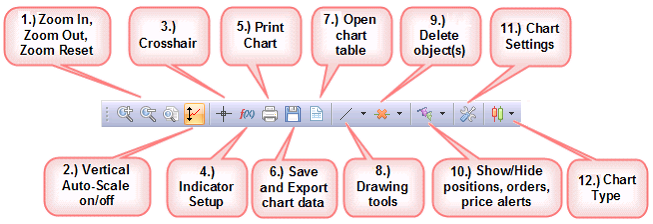
| 1.) | Zoom buttons. These buttons allow you to zoom in, zoom out, and reset the zoom to the default chart display. |
| 2.) | Vertical Auto-Scale. The Vertical Auto-Scale button determines whether the vertical scale of the chart will automatically change in order to fit in all vertical data, whenever the chart is scrolled or zoomed. |
| 3.) | Crosshair. The crosshair tool turns the cursor into a crosshair, allowing you to pinpoint exact locations on the chart. |
| 4.) | Indicator Setup. Opens the indicator setup menu, where you can configure the indicators appearing in the chart. |
| 5.) | Print Chart. Prints the chart. |
| 6.) | Save and Export chart data. This feature lets you export data from the current chart in the form of a table. |
| 7.) | Open Chart Table. This button will open the chart in the form of a table. |
| 8.) | Drawing Tools. This is a pull-down menu allowing you to choose from several drawing tools: |
| 9.) | Delete Object(s). This button allows you to remove a selected line, or all lines, from the chart. |
| 10.) | Show/Hide Orders, Open and Closed Positions. Push this button to show/hide Orders, Open and Closed Positions on the chart. You can click on the arrow next to the button to hide/show these items separately. |
| 11.) | Chart Settings. Opens the chart settings menu. |
| 12.) | Chart Type. Allows you to select the type of the chart: candlestick, bar, or line. |
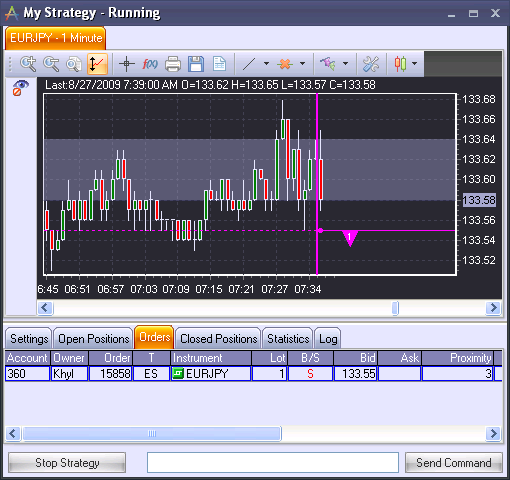
Displaying Orders and Positions in the Chart
You can choose whether you want to see the entry orders, the open positions and the closed positions displayed in the chart.
Note: You will see only those positions and orders that were opened, closed and created by this particular strategy.
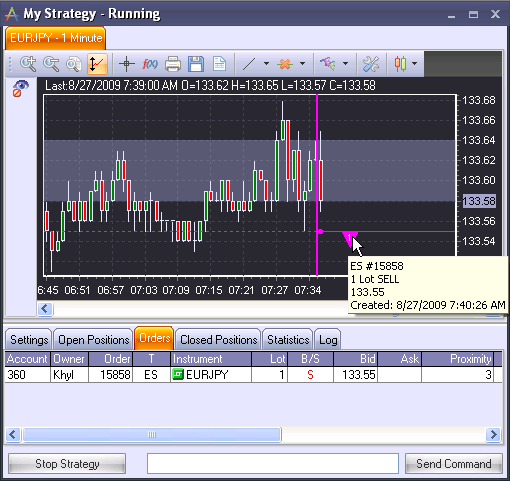
Each open position, order, and closed position has its own triangle marker. The triangles allow the user to review and modify positions and orders.
Upward triangles indicate a BUY direction for the position/order. Downward triangles indicate a SELL direction for the position/order.
Note: he triangle colors displayed and referred to here are system defaults. Triangle color settings can be changed in the chart menu.
Entry orders are marked with a pink line and triangle marker. Orders to open a position (I orders) that have not been confirmed by the dealer are marked as a translucent open position triangle. Orders to close a position (C orders) are shown as a translucent open position triangle attached to the triangle of the position that is to be closed, and pointing in the opposite direction. Stop/limit orders are marked with an orange line and triangle marker. The point of order creation is marked with a dot. The line to the left of the dot is perforated; the line to the right of the dot is solid. An upward triangle indicates a buy order; a downward triangle indicates a sell order.
Hover the cursor over the order triangle to view information about the order, including:
| 1) | The position ID |
| 2) | The number of lots, Buy or Sell |
| 3) | The open rate |
| 4) | Date and time when the order was created |
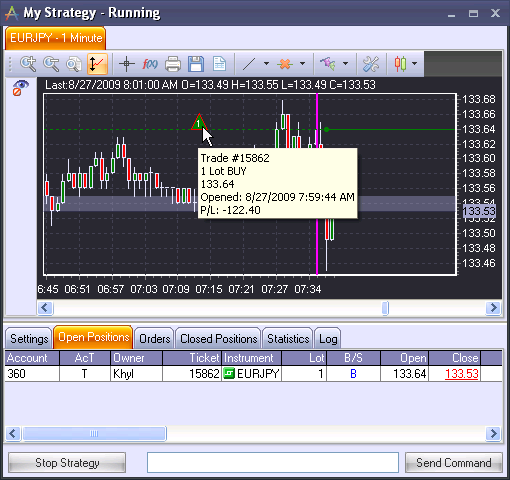
Open positions are marked by a horizontal green line with a green triangle at the rate where the position was opened. The moment the position was opened is marked by a green dot. The line to the right of the dot is solid; the line to the left of the dot is dotted. An upward triangle indicates a buy position; a downward triangle indicates a sell position. The number inside the triangle is the number of lots in the position. Triangles representing positions with a negative P/L have a red border.
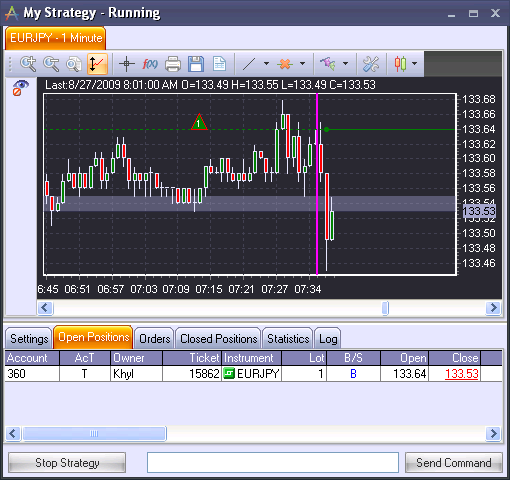
Hover the cursor over the position triangle to view information about the position, including:
| 1) | The position ID |
| 2) | The number of lots, Buy or Sell |
| 3) | The open rate |
| 4) | Date and time when the position was opened |
| 5) | Profit/Loss |
| 6) | Stop order ticket and rate if there is one |
| 7) | Limit order ticket and rate if there is one |
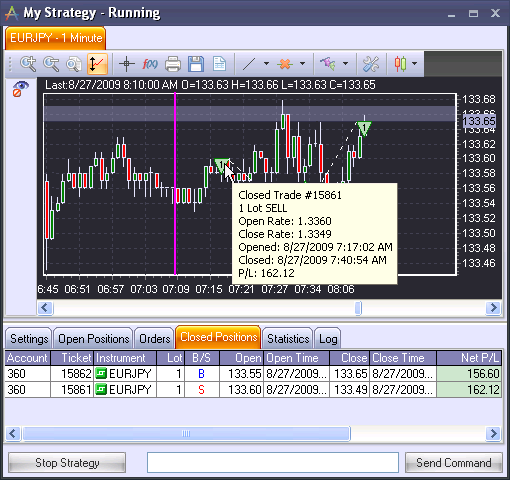
Closed positions are marked by a line connecting two green triangles: one at the time and rate when the position was opened, and the other one at the time and rate when it was closed. An upward triangle indicates a buy operation; a downward triangle indicates a sell operation. The number inside the triangle is the number of lots in the position. Triangles representing positions with a negative P/L have a red border.
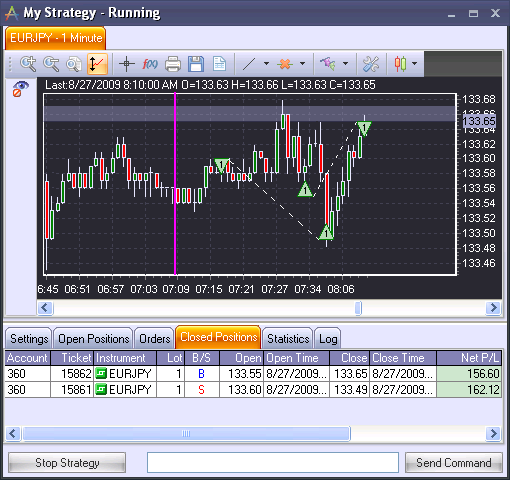
Hover the cursor over the position triangle to view information about the position, including:
| 1) | The position ID |
| 2) | The number of lots, Buy or Sell |
| 3) | The open rate |
| 4) | The close rate |
| 5) | Date and time when the position was opened |
| 6) | Date and time when the position was closed |
| 7) | Profit/Loss |